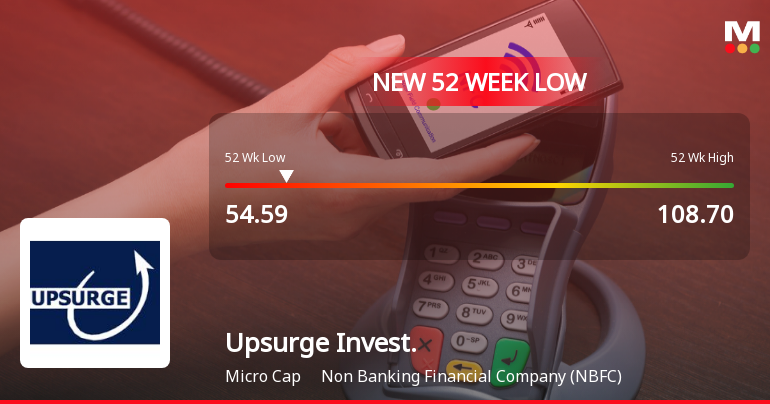
Upsurge Invest.

  • Market Cap: Micro Cap
  • Industry: Non Banking Financial Company (NBFC)
  • ISIN: INE890B01014
  • NSEID:
  • BSEID: 531390
INR
67.00
-1.23 (-1.8%)
BSENSE

Aug 17, 02:08 PM

BSE+NSE Vol: 94.49 k

  • Price Points
  • Score
  • Mojo Parameters
  • Total Return
  • News and Corporate Actions
  • Key factors
  • Shareholding
  • Financials
  • CompanyCV
stock-summaryPrice Point
High/Low

1Day

52 Week

Valuation
Technical
Day's Volume

CASH

94.49 k (884.00%) Volume

Shareholding (Jun 2026)

FII

0.00%

Held by 0 FIIs

DII

0.00%

Held by 0 DIIs

Promoter

54.56%

Why is Upsurge Investment & Finance Ltd falling/rising?

17-Aug-2026

As of 16-Aug, Upsurge Investment & Finance Ltd's stock price is declining at Rs 68.21, down 4.64%, with significant underperformance compared to the Sensex and reduced investor participation. The stock has shown volatility and a bearish trend, indicated by its movement relative to various moving averages.

As of 16-Aug, Upsurge Investment & Finance Ltd is experiencing a decline in its stock price, currently at Rs 68.21, which reflects a change of -3.32 (-4.64%). This downward movement is part of a broader trend, as the stock has been underperforming significantly compared to the benchmark Sensex, with a 1-week decline of -11.99% against the Sensex's -0.62%. <BR><BR>The stock has also shown a consecutive fall over the last three days, resulting in a total drop of -14.08% during this period. Today's trading saw the stock reach a high of Rs 74.8 but also a low of Rs 68, indicating volatility within the trading session. Furthermore, the weighted average price suggests that more volume was traded closer to the low price, indicating a lack of confidence among investors.<BR><BR>Investor participation has notably decreased, with delivery volume dropping by -49.12% compared to the 5-day average, signaling reduced interest in the stock. Although the stock remains above its 50-day and 100-day moving averages, it is below the 5-day, 20-day, and 200-day moving averages, which may indicate a bearish trend.<BR><BR>Overall, the combination of recent performance, declining investor participation, and volatility in trading suggests that Upsurge Investment & Finance Ltd is currently facing downward pressure on its stock price.

View full answer

Who are in the management team of Upsurge Invest.?

14-Aug-2026

The management team of Upsurge Invest includes D K Goyal (Chairman & Managing Director), Dinesh S Vijayvargia, Hansraj Goyal, Kiran Vaidya, and Sukdeo Agrawal (all Non-Executive & Independent Directors), Pratibha Goyal (Non-Executive & Non-Independent Director), and company secretaries Ela Gupta and Diksha Joshi.

The management team of Upsurge Invest includes the following individuals:<BR><BR>1. D K Goyal - Chairman & Managing Director<BR>2. Dinesh S Vijayvargia - Non-Executive & Independent Director<BR>3. Hansraj Goyal - Non-Executive & Independent Director<BR>4. Pratibha Goyal - Non-Executive & Non-Independent Director<BR>5. Kiran Vaidya - Non-Executive & Independent Director<BR>6. Sukdeo Agrawal - Non-Executive & Independent Director<BR>7. Ela Gupta - Company Secretary<BR>8. Diksha Joshi - Company Secretary<BR><BR>If you have any more questions about the company or its management, feel free to ask!

View full answer

What does Upsurge Invest. do?

14-Aug-2026

Upsurge Investment & Finance Ltd is a micro-cap NBFC providing financial advisory and managerial services to small and mid-size enterprises. As of June 2026, it reported net sales of 29 Cr and a net profit of 16 Cr, with a market cap of INR 170 Cr.

Overview: <BR>Upsurge Investment & Finance Ltd is a fast-growing Non Banking Financial Company (NBFC) in the micro-cap category, engaged in providing financial advisory, capital-growing, and holistic managerial services to small and mid-size enterprises.<BR><BR>History: <BR>Incorporated in 1994, Upsurge Investment & Finance Ltd initially focused on finance and investment business activities. The company went public in 1995, and the latest quarterly results reported net sales and net profit for June 2026.<BR><BR>Financial Snapshot: <BR>Most recent Net Sales: 29 Cr (Quarterly Results - Jun 2026) <BR>Most recent Net Profit: 16 Cr (Quarterly Results - Jun 2026) <BR>Market-cap value: INR 170 Cr (Micro Cap)<BR><BR>Key Metrics: <BR>P/E: 13.00 <BR>Industry P/E: 21 <BR>Dividend Yield: 0.00% <BR>Debt Equity: 0.23 <BR>Return on Equity: 10.33% <BR>Price to Book: 1.48 <BR><BR>Contact Details: <BR>Address: No 303 Morya Landmark-I Behind, Crystal Plaza Andheri (West) Mumbai Maharashtra : 400053 <BR>Tel: 91-22-67425441 <BR>Email: info@upsurgeinvestment.com <BR>Website: http://www.upsurgeinvestment.com

View full answer

Who are the peers of the Upsurge Invest.?

14-Aug-2026

Peers of Upsurge Invest. include Tilak Ventures, Delphi World, Supra Pacific, and others. Upsurge Invest. has average management risk and below-average growth, with a 1-year return of -34.13%.

Peers: The peers of Upsurge Invest. are Tilak Ventures, Delphi World, Supra Pacific, Paul Merchants, Maha Rashtra Apx, Baid Finserv, RSD Finance, Raama Finance, and Beacon Trust.<BR><BR>Quality Snapshot: Excellent management risk is observed at Tilak Ventures, Delphi World, Supra Pacific, and Beacon Trust, while Average management risk is found at Upsurge Invest. and Maha Rashtra Apx. Growth is rated as Excellent for Tilak Ventures, Delphi World, Supra Pacific, Raama Finance, and IBL Finance, while Below Average growth is noted for Upsurge Invest., Paul Merchants, Maha Rashtra Apx, Baid Finserv, and RSD Finance. All peers have an Excellent capital structure.<BR><BR>Return Snapshot: Raama Finance has the highest 1-year return at 265.59%, while Delphi World has the lowest at -47.56%. Upsurge Invest.'s 1-year return of -34.13% is better than Delphi World but worse than Raama Finance. Additionally, the six-month return is negative for Upsurge Invest., Delphi World, Paul Merchants, Baid Finserv, and RSD Finance.

View full answer

How big is Upsurge Invest.?

14-Aug-2026

As of 14th August, Upsurge Investment & Finance Ltd has a market capitalization of 149.50 Cr, with recent net sales of 60.72 Cr and a net profit of 11.62 Cr. Shareholder's funds are 104.83 Cr, and total assets amount to 107.34 Cr as of March 2025.

As of 14th August, Upsurge Investment & Finance Ltd has a market capitalization of 149.50 Cr, categorizing it as a Micro Cap company.<BR><BR>In the latest four quarters, the company reported Net Sales of 60.72 Cr and a Net Profit of 11.62 Cr.<BR><BR>The latest annual period for the balance sheet is March 2025, with Shareholder's Funds amounting to 104.83 Cr and Total Assets of 107.34 Cr.

View full answer

Should I buy, sell or hold Upsurge Investment & Finance Ltd?

12-Aug-2026

Has Upsurge Investment & Finance Ltd declared dividend?

12-Aug-2026

Upsurge Investment & Finance Ltd has declared a 5% dividend, with an ex-date of August 21, 2026. The current dividend yield is 0%, and total returns have varied across periods, showing significant long-term gains despite recent short-term declines.

Upsurge Investment & Finance Ltd has declared a 5% dividend.<BR><BR>Dividend Details:<BR>- Percentage announced: 5%<BR>- Ex-date: 21 Aug 26<BR><BR>Dividend Yield: 0%<BR><BR>Total Returns by Period:<BR>In the last 3 months, the price return was 14.28%, the dividend return was 0.77%, resulting in a total return of 15.05%.<BR><BR>Over the last 6 months, the price return was -5.41%, with a dividend return of 0.63%, leading to a total return of -4.78%.<BR><BR>In the past year, the price return was -33.64%, while the dividend return was 0.47%, culminating in a total return of -33.17%.<BR><BR>For the 2-year period, the price return was -33.56%, the dividend return was 0.78%, resulting in a total return of -32.78%.<BR><BR>During the last 3 years, the price return was 85.8%, with a dividend return of 2.63%, leading to a total return of 88.43%.<BR><BR>In the last 4 years, the price return was 38.16%, the dividend return was 3.22%, resulting in a total return of 41.38%.<BR><BR>Over the past 5 years, the price return was 108.11%, while the dividend return was 8.20%, culminating in a total return of 116.31%.<BR><BR>Overall, Upsurge Investment & Finance Ltd has declared a dividend, but the dividend yield is currently 0%. The total returns over various periods show a mixed performance, with significant gains over the longer term despite recent declines in shorter periods.

View full answer

When is the next results date for Upsurge Investment & Finance Ltd?

31-Jul-2026

The next results date for Upsurge Investment & Finance Ltd is 10 August 2026.

The next results date for Upsurge Investment & Finance Ltd is scheduled for 10 August 2026.

View full answer

Are Upsurge Investment & Finance Ltd latest results good or bad?

27-May-2026

The latest results for Upsurge Investment & Finance Ltd are concerning, showing a net loss of ₹6.23 crore in Q4 FY26 compared to a profit in the previous quarter, alongside a 64.34% drop in revenue. These metrics indicate significant operational distress and raise serious questions about the company's future viability.

The latest results for Upsurge Investment & Finance Ltd are concerning and indicate a significant deterioration in financial performance. In Q4 FY26, the company reported a net loss of ₹6.23 crore, marking a stark contrast to the profit of ₹0.85 crore in the previous quarter. Revenue also plummeted to ₹2.66 crore, which represents a dramatic decline of 64.34% quarter-over-quarter and a staggering 92.73% year-on-year.<BR><BR>The operating margin was severely negative at -290.98%, reflecting substantial operational distress, as costs far exceeded revenue generation capabilities. This quarter's results raise serious questions about the company's business sustainability and operational stability, especially given the previous year's strong performance.<BR><BR>Overall, the financial metrics indicate a troubling trend, with the company facing critical challenges that could impact its future viability. Investors should approach with caution, as the recent performance suggests significant risks ahead.

View full answer

How has been the historical performance of Upsurge Invest.?

13-Nov-2025

Upsurge Invest has shown significant growth from March 2023 to March 2025, with net sales increasing from 32.56 Cr to 111.23 Cr and profit after tax rising from 0.50 Cr to 15.95 Cr, reflecting strong revenue and profitability improvements. Total assets also grew from 41.86 Cr to 107.34 Cr, indicating a robust financial position.

Answer:<BR>The historical performance of Upsurge Invest shows significant growth in various financial metrics over the years, particularly from March 2023 to March 2025.<BR><BR>Breakdown:<BR>Upsurge Invest's net sales have increased dramatically from 32.56 Cr in March 2023 to 111.23 Cr in March 2025, indicating a strong upward trend. Other operating income also rose from 0.08 Cr in March 2023 to 1.93 Cr in March 2025, contributing to a total operating income of 113.16 Cr in March 2025, up from 32.64 Cr in March 2023. The total expenditure, excluding depreciation, increased from 31.74 Cr in March 2023 to 93.91 Cr in March 2025, yet the operating profit (PBDIT) surged from 0.90 Cr to 19.76 Cr during the same period. Profit before tax followed a similar trajectory, climbing from 0.87 Cr in March 2023 to 19.73 Cr in March 2025, while profit after tax rose from 0.50 Cr to 15.95 Cr. The earnings per share (EPS) also improved significantly, reaching 7.95 in March 2025 compared to just 0.33 in March 2023. On the balance sheet, total assets grew from 41.86 Cr in March 2023 to 107.34 Cr in March 2025, with total liabilities increasing from 41.86 Cr to 107.34 Cr as well. Cash and cash equivalents at the end of March 2025 stood at 24.80 Cr, up from 11.95 Cr in March 2023, reflecting a healthy liquidity position. Overall, Upsurge Invest has demonstrated robust growth in revenue, profitability, and asset base over the past few years.

View full answer

Is Upsurge Invest. overvalued or undervalued?

13-Nov-2025

As of November 12, 2025, Upsurge Invest. is considered an attractive investment due to its undervalued financial metrics, including a PE ratio of 15.54 and a strong ROCE of 24.78%, despite a year-to-date stock decline of 54.45%.

As of 12 November 2025, the valuation grade for Upsurge Invest. has moved from very attractive to attractive. The company is currently considered undervalued based on its financial metrics. The PE ratio stands at 15.54, while the EV to EBITDA ratio is 11.11, and the ROCE is a strong 24.78%. <BR><BR>In comparison to its peers, Upsurge Invest. has a more favorable valuation than Bajaj Finance, which is very expensive with a PE ratio of 34.41, and Life Insurance, which is very attractive with a PE of 11.14. Despite recent stock performance showing a significant decline of 54.45% year-to-date compared to a 8.10% gain in the Sensex, the underlying financial ratios suggest that Upsurge Invest. remains a compelling investment opportunity in the current market.

View full answer

How has been the historical performance of Upsurge Invest.?

12-Nov-2025

Upsurge Invest has demonstrated significant growth from March 2023 to March 2025, with net sales increasing from 32.56 Cr to 111.23 Cr, and profit after tax rising from 0.50 Cr to 15.95 Cr. The company's total assets also grew from 41.86 Cr to 107.34 Cr, indicating a strong financial performance trajectory.

Answer:<BR>The historical performance of Upsurge Invest shows significant growth in various financial metrics over the years, particularly from March 2023 to March 2025.<BR><BR>Breakdown:<BR>Upsurge Invest's net sales have increased markedly from 32.56 Cr in March 2023 to 111.23 Cr in March 2025, demonstrating a strong upward trend. Other operating income also saw a rise, albeit from a low base, reaching 1.93 Cr in March 2025 from just 0.08 Cr in March 2023. Total operating income followed suit, climbing from 32.64 Cr in March 2023 to 113.16 Cr in March 2025. The company's total expenditure, excluding depreciation, rose from 31.74 Cr in March 2023 to 93.91 Cr in March 2025, reflecting increased operational costs. Operating profit, excluding other income, improved significantly from 0.90 Cr in March 2023 to 19.25 Cr in March 2025, while profit before tax also surged from 0.87 Cr to 19.73 Cr in the same period. Consequently, profit after tax increased from 0.50 Cr in March 2023 to 15.95 Cr in March 2025. The earnings per share (EPS) rose from 0.33 in March 2023 to 7.95 in March 2025, indicating enhanced profitability per share. On the balance sheet, total assets grew from 41.86 Cr in March 2023 to 107.34 Cr in March 2025, with total liabilities increasing from 41.86 Cr to 107.34 Cr as well. Cash and cash equivalents also improved, reaching 24.80 Cr in March 2025 from 11.95 Cr in March 2023, reflecting better liquidity. Overall, Upsurge Invest has shown a robust financial performance trajectory over the past few years.

View full answer

Who are the top shareholders of the Upsurge Invest.?

17-Jul-2025

The top shareholders of Upsurge Invest are Gagan Deep Multitrade Private Limited with 17.15%, and Vikas Vijaykumar Khemani, the highest public shareholder, with 6.88%. Individual investors hold a total of 33.72%, with no pledged promoter holdings or foreign institutional investors involved.

The top shareholders of Upsurge Invest include Gagan Deep Multitrade Private Limited, which holds the highest promoter stake at 17.15%. Additionally, Vikas Vijaykumar Khemani is the highest public shareholder with a holding of 6.88%. Overall, individual investors collectively hold 33.72% of the company. There are no pledged promoter holdings, and the company has no foreign institutional investors (FIIs) or mutual fund schemes holding shares.

View full answer

What is the technical trend for Upsurge Invest.?

09-Jun-2025

As of June 5, 2025, Upsurge Invest shows a mildly bullish trend based on weekly indicators, despite some short-term bearish signals from daily moving averages.

As of 5 June 2025, the technical trend for Upsurge Invest has changed from sideways to mildly bullish. The weekly MACD indicates a mildly bullish stance, supported by a bullish signal from the Bollinger Bands and a mildly bullish KST. The Dow Theory also aligns with this view on a weekly basis. However, the daily moving averages are mildly bearish, which suggests some short-term weakness. Overall, the current technical stance is mildly bullish, driven primarily by the weekly indicators, despite some mixed signals from the daily moving averages.

View full answer
iScoreScore
Click here to find our call on this stock
Strong Sell
Sell
Hold
Buy
Strong Buy

Dashboard

1

Weak Long Term Fundamental Strength with a 8.09% CAGR growth in Operating Profits

 
2

Underperformed the market in the last 1 year

stock-summaryMojo Parameters

Mojo Parameters

Loading Valuation Snapshot...

Stock DNA

stock-summary
Industry

Non Banking Financial Company (NBFC)

stock-summary
Market cap

INR 147 Cr (Micro Cap)

stock-summary
P/E

13.00

stock-summary
Industry P/E

21

stock-summary
Dividend Yield

0.00%

stock-summary
Debt Equity

0.23

stock-summary
Return on Equity

10.33%

stock-summary
Price to Book

1.33

Revenue and Profits:
Net Sales:
29 Cr
(Quarterly Results - Jun 2026)
Net Profit:
16 Cr
stock-summaryTotal Returns
Total Returns (Price + Dividend) stock-summary
Dividend Yield (0%)
TimePeriod
Price Return
Dividend Return
Total Return
3 Months
4.04%
0.80%
4.84%
6 Months
-9.48%
0.64%
-8.84%
1 Year
-37.3%
0.47%
-36.83%
2 Years
-43.45%
0.37%
-43.08%
3 Years
75.16%
2.47%
77.63%
4 Years
34.4%
3.20%
37.6%
5 Years
116.83%
8.71%
125.54%

Latest dividend: 0.5 per share ex-dividend date: Aug-23-2024

Risk Adjusted Returns v/s stock-summary
Returns Beta
Icon
Beta has not been calculated since enough price history is not available
stock-summaryNews & Corporate Actions

News

Announcements stock-summary

Announcement under Regulation 30 (LODR)-Newspaper Publication

12-Aug-2026 | Source : BSE

The Newspaper Publication of Unaudited standalone Financial Results of the Company for the Quarter ended 30.06.2026

Corporate Action-Board to consider Dividend

10-Aug-2026 | Source : BSE

The Board in its meeting held on 10.08.2026 has declared interim dividend @ 5% for the FY 2026-2027

Pursuant To Provisions Of Regulation 33 Of SEBI (LODR) Regulations 2015. We Here By Submit The Unaudited Financial Results For The Quarter Ended Jun 30Th 2026 Along With Limited Review Report

10-Aug-2026 | Source : BSE

Board in its meeting held on 10.08.2026 approved the Financial Results for the quarter ended 30.06.2026 and declared interim dividend @ 5% for the Financial Year 2026-2027.

Corporate Actions stock-summary

stock-summary
BOARD MEETING

No Upcoming Board Meetings

stock-summary
DIVIDEND

Upsurge Investment & Finance Ltd has declared 5% dividend, ex-date: 21 Aug 26

stock-summary
SPLITS

No Splits history available

stock-summary
BONUS

No Bonus history available

stock-summary
RIGHTS

No Rights history available

stock-summaryKey Factors

Quality key factors stock-summary

Factor
Value
Sales Growth (5y)
17.16%
EBIT Growth (5y)
8.09%
Net Debt to Equity (avg)
0.23
Institutional Holding
0
ROE (avg)
16.67%

Valuation key factors

Factor
Value
P/E Ratio
13
Industry P/E
21
Price to Book Value
1.33
EV to EBIT
9.38
EV to EBITDA
9.35
EV to Capital Employed
1.34
EV to Sales
2.16
PEG Ratio
NA
Dividend Yield
NA
ROCE (Latest)
11.63%
ROE (Latest)
10.33%

Technicals key factors

Indicator
Weekly
Monthly
MACD
Mildly Bullish
Bearish
RSI
No Signal
No Signal
Bollinger Bands
Mildly Bullish
Bearish
Moving Averages
Mildly Bearish (Daily)
KST
Bullish
Bearish
Dow Theory
Mildly Bullish
Mildly Bullish
stock-summary Technical Indicator Scale: Bearish, Mildly Bearish, Sideways, Mildly Bullish, Bullish  Turned 
stock-summaryShareholding
Shareholding Snapshot : Jun 2026stock-summary
Shareholding Compare (%holding) stock-summary
Majority shareholders

Promoters

Pledged Promoter Holdings

None

Mutual Funds

Held by 0 Schemes

FIIs

Held by 0 FIIs

Promoter with highest holding

Gagan Deep Multitrade Private Limited (15.71%)

Highest Public shareholder

Vikas Vijaykumar Khemani (6.3%)

Individual Investors Holdings

30.28%

stock-summaryFinancial
[
  {
    "link": "quarterly",
    "btn_text": "All Quarterly Results",
    "header": "Quarterly Results Snapshot (Standalone) - Jun'26 - QoQ",
    "rhs": [
      {
        "prefix": "Net Sales ",
        "suffix": "QoQ Growth in quarter ended Jun 2026 is 1,000.75% vs -64.34% in Mar 2026",
        "dir": 1
      },
      {
        "prefix": "Standalone Net Profit ",
        "suffix": "QoQ Growth in quarter ended Jun 2026 is 357.78% vs -832.94% in Mar 2026",
        "dir": 1
      }
    ],
    "table": {
      "header": [
        "Jun'26",
        "Mar'26",
        "Change(%)"
      ],
      "body": [
        {
          "field": "Net Sales",
          "val1": "29.28",
          "val2": "2.66",
          "chgp": "1,000.75%",
          "chgp_class": "positive"
        },
        {
          "field": "Operating Profit (PBDIT) excl Other Income",
          "val1": "20.59",
          "val2": "-7.74",
          "chgp": "366.02%",
          "chgp_class": "positive"
        },
        {
          "field": "Interest",
          "val1": "0.03",
          "val2": "0.25",
          "chgp": "-88.00%",
          "chgp_class": "positive"
        },
        {
          "field": "Exceptional Items",
          "val1": "0.00",
          "val2": "0.00",
          "chgp": "",
          "chgp_class": "neutral"
        },
        {
          "field": "Standalone Net Profit",
          "val1": "16.06",
          "val2": "-6.23",
          "chgp": "357.78%",
          "chgp_class": "positive"
        },
        {
          "field": "Operating Profit Margin (Excl OI)",
          "val1": "70.32%",
          "val2": "-290.98%",
          "chgp": "361.30%",
          "chgp_class": "positive"
        }
      ]
    }
  },
  {
    "link": "half-yearly",
    "btn_text": "All Half Yearly Results",
    "header": "Half Yearly Results Snapshot (Standalone) - Sep'25",
    "rhs": [
      {
        "prefix": "Net Sales ",
        "suffix": " Growth in half year ended Sep 2025 is -28.97% vs 176.25% in Sep 2024",
        "dir": -1
      },
      {
        "prefix": "Standalone Net Profit ",
        "suffix": " Growth in half year ended Sep 2025 is -37.94% vs 129.97% in Sep 2024",
        "dir": -1
      }
    ],
    "table": {
      "header": [
        "Sep'25",
        "Sep'24",
        "Change(%)"
      ],
      "body": [
        {
          "field": "Net Sales",
          "val1": "40.48",
          "val2": "56.99",
          "chgp": "-28.97%",
          "chgp_class": "negative"
        },
        {
          "field": "Operating Profit (PBDIT) excl Other Income",
          "val1": "10.16",
          "val2": "17.51",
          "chgp": "-41.98%",
          "chgp_class": "negative"
        },
        {
          "field": "Interest",
          "val1": "0.28",
          "val2": "0.12",
          "chgp": "133.33%",
          "chgp_class": "negative"
        },
        {
          "field": "Exceptional Items",
          "val1": "0.00",
          "val2": "0.00",
          "chgp": "",
          "chgp_class": "neutral"
        },
        {
          "field": "Standalone Net Profit",
          "val1": "8.62",
          "val2": "13.89",
          "chgp": "-37.94%",
          "chgp_class": "negative"
        },
        {
          "field": "Operating Profit Margin (Excl OI)",
          "val1": "25.10%",
          "val2": "30.72%",
          "chgp": "-5.62%",
          "chgp_class": "negative"
        }
      ]
    }
  },
  {
    "link": "nine-monthly",
    "btn_text": "All Nine Monthly Results",
    "header": "Nine Monthly Results Snapshot (Standalone) - Dec'25",
    "rhs": [
      {
        "prefix": "Net Sales ",
        "suffix": "YoY Growth in nine months ended Dec 2025 is -35.78% vs 99.44% in Dec 2024",
        "dir": -1
      },
      {
        "prefix": "Standalone Net Profit ",
        "suffix": "YoY Growth in nine months ended Dec 2025 is -39.49% vs 83.47% in Dec 2024",
        "dir": -1
      }
    ],
    "table": {
      "header": [
        "Dec'25",
        "Dec'24",
        "Change(%)"
      ],
      "body": [
        {
          "field": "Net Sales",
          "val1": "47.94",
          "val2": "74.65",
          "chgp": "-35.78%",
          "chgp_class": "negative"
        },
        {
          "field": "Operating Profit (PBDIT) excl Other Income",
          "val1": "11.76",
          "val2": "19.62",
          "chgp": "-40.06%",
          "chgp_class": "negative"
        },
        {
          "field": "Interest",
          "val1": "0.71",
          "val2": "0.46",
          "chgp": "54.35%",
          "chgp_class": "negative"
        },
        {
          "field": "Exceptional Items",
          "val1": "0.00",
          "val2": "0.00",
          "chgp": "",
          "chgp_class": "neutral"
        },
        {
          "field": "Standalone Net Profit",
          "val1": "9.47",
          "val2": "15.65",
          "chgp": "-39.49%",
          "chgp_class": "negative"
        },
        {
          "field": "Operating Profit Margin (Excl OI)",
          "val1": "21.63%",
          "val2": "25.62%",
          "chgp": "-3.99%",
          "chgp_class": "negative"
        }
      ]
    }
  },
  {
    "link": "annual",
    "btn_text": "All Annual Results",
    "header": "Annual Results Snapshot (Standalone) - Mar'26",
    "rhs": [
      {
        "prefix": "Net Sales ",
        "suffix": "YoY Growth in year ended Mar 2026 is -57.42% vs 92.04% in Mar 2025",
        "dir": -1
      },
      {
        "prefix": "Standalone Net Profit ",
        "suffix": "YoY Growth in year ended Mar 2026 is -79.75% vs 41.65% in Mar 2025",
        "dir": -1
      }
    ],
    "table": {
      "header": [
        "Mar'26",
        "Mar'25",
        "Change(%)"
      ],
      "body": [
        {
          "field": "Net Sales",
          "val1": "47.36",
          "val2": "111.23",
          "chgp": "-57.42%",
          "chgp_class": "negative"
        },
        {
          "field": "Operating Profit (PBDIT) excl Other Income",
          "val1": "3.34",
          "val2": "19.25",
          "chgp": "-82.65%",
          "chgp_class": "negative"
        },
        {
          "field": "Interest",
          "val1": "0.95",
          "val2": "0.64",
          "chgp": "48.44%",
          "chgp_class": "negative"
        },
        {
          "field": "Exceptional Items",
          "val1": "0.00",
          "val2": "0.00",
          "chgp": "",
          "chgp_class": "neutral"
        },
        {
          "field": "Standalone Net Profit",
          "val1": "3.23",
          "val2": "15.95",
          "chgp": "-79.75%",
          "chgp_class": "negative"
        },
        {
          "field": "Operating Profit Margin (Excl OI)",
          "val1": "7.05%",
          "val2": "17.31%",
          "chgp": "-10.26%",
          "chgp_class": "negative"
        }
      ]
    }
  }
]

Quarterly Results Snapshot (Standalone) - Jun'26 - QoQstock-summary

Jun'26
Mar'26
Change(%)
Net Sales
29.28
2.66
1,000.75%
Operating Profit (PBDIT) excl Other Income
20.59
-7.74
366.02%
Interest
0.03
0.25
-88.00%
Exceptional Items
0.00
0.00
Standalone Net Profit
16.06
-6.23
357.78%
Operating Profit Margin (Excl OI)
70.32%
-290.98%
361.30%
Values in Rs Cr.
Direction Arrows
Net Sales

QoQ Growth in quarter ended Jun 2026 is 1,000.75% vs -64.34% in Mar 2026

Direction Arrows
Standalone Net Profit

QoQ Growth in quarter ended Jun 2026 is 357.78% vs -832.94% in Mar 2026

Half Yearly Results Snapshot (Standalone) - Sep'25stock-summary

Sep'25
Sep'24
Change(%)
Net Sales
40.48
56.99
-28.97%
Operating Profit (PBDIT) excl Other Income
10.16
17.51
-41.98%
Interest
0.28
0.12
133.33%
Exceptional Items
0.00
0.00
Standalone Net Profit
8.62
13.89
-37.94%
Operating Profit Margin (Excl OI)
25.10%
30.72%
-5.62%
Values in Rs Cr.
Direction Arrows
Net Sales

Growth in half year ended Sep 2025 is -28.97% vs 176.25% in Sep 2024

Direction Arrows
Standalone Net Profit

Growth in half year ended Sep 2025 is -37.94% vs 129.97% in Sep 2024

Nine Monthly Results Snapshot (Standalone) - Dec'25stock-summary

Dec'25
Dec'24
Change(%)
Net Sales
47.94
74.65
-35.78%
Operating Profit (PBDIT) excl Other Income
11.76
19.62
-40.06%
Interest
0.71
0.46
54.35%
Exceptional Items
0.00
0.00
Standalone Net Profit
9.47
15.65
-39.49%
Operating Profit Margin (Excl OI)
21.63%
25.62%
-3.99%
Values in Rs Cr.
Direction Arrows
Net Sales

YoY Growth in nine months ended Dec 2025 is -35.78% vs 99.44% in Dec 2024

Direction Arrows
Standalone Net Profit

YoY Growth in nine months ended Dec 2025 is -39.49% vs 83.47% in Dec 2024

Annual Results Snapshot (Standalone) - Mar'26stock-summary

Mar'26
Mar'25
Change(%)
Net Sales
47.36
111.23
-57.42%
Operating Profit (PBDIT) excl Other Income
3.34
19.25
-82.65%
Interest
0.95
0.64
48.44%
Exceptional Items
0.00
0.00
Standalone Net Profit
3.23
15.95
-79.75%
Operating Profit Margin (Excl OI)
7.05%
17.31%
-10.26%
Values in Rs Cr.
Direction Arrows
Net Sales

YoY Growth in year ended Mar 2026 is -57.42% vs 92.04% in Mar 2025

Direction Arrows
Standalone Net Profit

YoY Growth in year ended Mar 2026 is -79.75% vs 41.65% in Mar 2025

stock-summaryCompany CV
About Upsurge Investment & Finance Ltd stock-summary
stock-summary
Upsurge Investment & Finance Ltd
Micro Cap
Non Banking Financial Company (NBFC)
Upsurge Investment & Finance Limited was incorporated in 1994 with the object of finance and investments business activities. The Company is a fast-growing NBFC engaged in providing financial advisory, capital-growing and holistic managerial services to small and mid-size enterprises. The Company started with a paid up capital of Rs. 3.25 millions and later went for public issue in 1995. Its maiden public issue had been subscribed.
Company Coordinates stock-summary
Company Details
No 303 Morya Landmark-I Behind, Crystal Plaza Andheri (West) Mumbai Maharashtra : 400053
stock-summary
Tel: 91-22-67425441
stock-summary
info@upsurgeinvestment.com
Registrar Details
Adroit Corporate Services Pvt Ltd, 17-20 Jaferbhoy Industrial Estate , 1st Floor, Makwana Road, Marol Naka, Mumbai