
Compare Uravi Defence & with Similar Stocks
Dashboard
Weak Long Term Fundamental Strength with a -17.03% CAGR growth in Operating Profits over the last 5 years
- Low ability to service debt as the company has a high Debt to EBITDA ratio of 5.39 times
- The company has been able to generate a Return on Equity (avg) of 4.60% signifying low profitability per unit of shareholders funds
Negative results in Dec 25
With ROCE of 3.6, it has a Very Expensive valuation with a 2.7 Enterprise value to Capital Employed
Reducing Promoter Confidence
Below par performance in long term as well as near term
Stock DNA
Auto Components & Equipments
INR 174 Cr (Micro Cap)
87.00
35
0.00%
0.45
3.44%
3.23
Total Returns (Price + Dividend) 
Uravi Defence & for the last several years.
Risk Adjusted Returns v/s
Returns Beta

News
When is the next results date for Uravi Defence & Technology Ltd?
The next results date for Uravi Defence & Technology Ltd is scheduled for April 11, 2026....
Read full news article
Uravi Defence & Technology Ltd is Rated Strong Sell
Uravi Defence & Technology Ltd is rated Strong Sell by MarketsMOJO. This rating was last updated on 13 Aug 2025. However, the analysis and financial metrics discussed here reflect the stock’s current position as of 06 April 2026, providing investors with an up-to-date perspective on the company’s performance and outlook.
Read full news article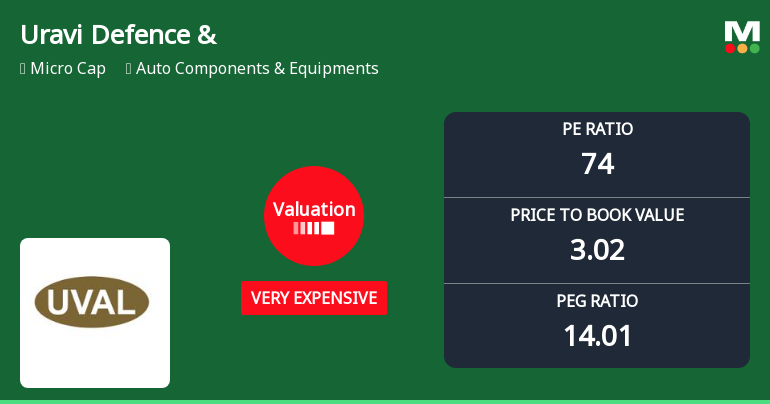
Uravi Defence & Technology Ltd Valuation Shifts Signal Heightened Price Risk
Uravi Defence & Technology Ltd, a micro-cap player in the Auto Components & Equipments sector, has seen a marked shift in its valuation parameters, moving from expensive to very expensive territory. Despite a recent surge in share price, the company’s elevated price-to-earnings (P/E) and price-to-book value (P/BV) ratios raise concerns about price attractiveness relative to historical levels and peer benchmarks.
Read full news article Announcements
Uravi T and Wedge Lamps Limited - Clarification - Financial Results
03-Dec-2019 | Source : NSEUravi T and Wedge Lamps Limitedge Lamps Limited for the quarter ended 30-Sep-2019 with respect to Regulation 33 of the SEBI (Listing Obligations and Disclosure Requirements) Regulations, 2015.
Uravi T and Wedge Lamps Limited - Updates
16-Oct-2019 | Source : NSEUravi T and Wedge Lamps Limited has informed the Exchange regarding 'Certificate under Regulation 74(5) of the SEBI (Depositories and Participants) Regulations, 2018 for the Quarter ended September 30, 2019'.
Corporate Actions

(11 Apr 2026)

No Dividend history available

No Splits history available

Uravi Defence & Technology Ltd has announced 1:1 bonus issue, ex-date: 11 Jul 22

No Rights history available
Quality key factors
Valuation key factors
Technicals key factors
 Technical Indicator Scale: Bearish, Mildly Bearish, Sideways, Mildly Bullish, Bullish Turned
 Shareholding Snapshot : Dec 2025
Shareholding Compare (%holding)
Promoters
7.1931
Held by 0 Schemes
Held by 6 FIIs (7.93%)
Niraj Damji Gada (16.28%)
Sangita Pravinkumar Tundiya (6.01%)
29.34%
Quarterly Results Snapshot (Standalone) - Dec'25 - YoY

YoY Growth in quarter ended Dec 2025 is 1.80% vs -13.10% in Dec 2024
YoY Growth in quarter ended Dec 2025 is 17.86% vs -26.32% in Dec 2024
Half Yearly Results Snapshot (Standalone) - Sep'25

Growth in half year ended Sep 2025 is -16.47% vs 14.65% in Sep 2024
Growth in half year ended Sep 2025 is 2.67% vs -36.97% in Sep 2024
Nine Monthly Results Snapshot (Standalone) - Dec'25
YoY Growth in nine months ended Dec 2025 is -10.79% vs 4.30% in Dec 2024
YoY Growth in nine months ended Dec 2025 is 6.80% vs -34.39% in Dec 2024
Annual Results Snapshot (Standalone) - Mar'25
YoY Growth in year ended Mar 2025 is -1.52% vs 23.83% in Mar 2024
YoY Growth in year ended Mar 2025 is -15.96% vs 144.83% in Mar 2024
About Uravi Defence & Technology Ltd

Company Coordinates


