Usha Martin

  • Market Cap: Small Cap
  • Industry: Iron & Steel Products
  • ISIN: INE228A01035
  • NSEID: USHAMART
  • BSEID: 517146
INR
503.20
3.6 (0.72%)
BSENSE

Sep 02, 01:39 PM

BSE+NSE Vol: 13.65 lacs

  • Price Points
  • Score
  • Mojo Parameters
  • Total Return
  • News and Corporate Actions
  • Key factors
  • Shareholding
  • Financials
  • CompanyCV
stock-summaryPrice Point
High/Low

1Day

52 Week

Valuation
Technical
Day's Volume

CASH

13.65 lacs (64.34%) Volume

Shareholding (Jun 2026)

FII

15.10%

Held by 141 FIIs

DII

15.26%

Held by 30 DIIs

Promoter

40.28%

Why is Usha Martin Ltd falling/rising?

02-Sep-2026

As of 01-Sep, Usha Martin Ltd's stock price is rising to Rs 500.10, driven by strong recent performance and positive financial indicators, including a high return on equity and increased investor interest. The stock has outperformed the benchmark Sensex and is nearing its 52-week high.

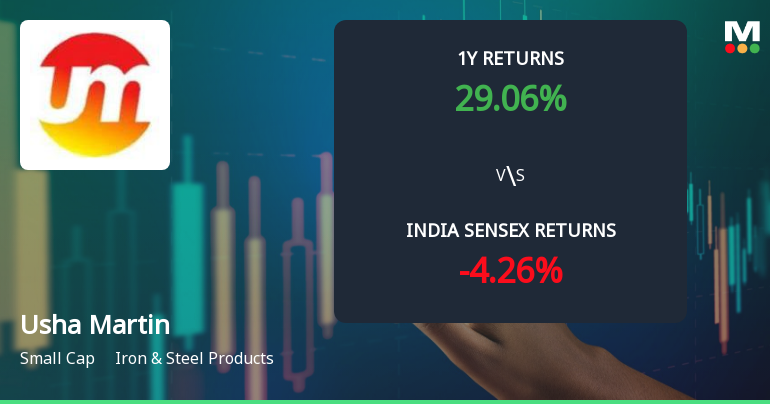
As of 01-Sep, Usha Martin Ltd's stock price is rising, currently at Rs 500.10, reflecting a change of 1.3 (0.26%) upward. This positive movement can be attributed to several factors. Over the past week, the stock has outperformed the benchmark Sensex, gaining 2.69% while the Sensex declined by 0.92%. Additionally, the stock has shown strong performance over the past year, with a return of 29.06%, significantly higher than the market's average return of 2.32%.<BR><BR>Today's performance indicates that Usha Martin is close to its 52-week high, being only 4.72% away from Rs 527. The stock has been on a consecutive gain streak for the last three days, accumulating a total return of 2.92% during this period. It also reached an intraday high of Rs 512.5, which is a 2.75% increase.<BR><BR>The stock's upward trend is further supported by its trading position above all key moving averages (5-day, 20-day, 50-day, 100-day, and 200-day), indicating a strong bullish sentiment. Investor participation has increased, with delivery volume rising by 67.34% compared to the 5-day average, suggesting heightened interest in the stock. <BR><BR>Moreover, Usha Martin's financial health is robust, with a high return on equity (ROE) of 16.43% and a low debt-to-equity ratio of 0.08, which enhances its attractiveness to investors. The company has also reported positive results for the last four consecutive quarters, with significant growth in profit after tax and net sales.<BR><BR>In summary, the combination of strong recent performance, positive financial indicators, and increased investor interest contributes to the rising stock price of Usha Martin Ltd.

View full answer

Who are in the management team of Usha Martin?

01-Sep-2026

The management team of Usha Martin includes R Jhawar (Managing Director), Shampa Ghosh Ray (Company Secretary), and several independent and non-executive directors, including Vijay Singh Bapna (Chairman). They oversee the company's operations and strategic direction.

The management team of Usha Martin includes the following individuals:<BR><BR>1. R Jhawar - Managing Director<BR>2. Shampa Ghosh Ray - Company Secretary & Compliance Officer<BR>3. Ramni Nirula - Non-Executive & Independent Director<BR>4. Venkatachalam Ramakrishna Iyer - Independent Director<BR>5. S Ravi - Independent Director<BR>6. Vijay Singh Bapna - Chairman & Independent Director<BR>7. Sumit Kumar Modak - Whole-time Director<BR>8. Tapas Gangopadhyay - Non-Executive Director<BR><BR>This team is responsible for overseeing the company's operations and strategic direction.

View full answer

What does Usha Martin do?

01-Sep-2026

Usha Martin Ltd is a leading specialty steel producer and one of the largest wire rope manufacturers globally, with a market cap of INR 14,826 Cr. As of June 2026, it reported net sales of 1,033 Cr and a net profit of 142 Cr.

Overview:<BR>Usha Martin Ltd is a leading producer of specialty steel and one of the largest wire rope manufacturers globally, operating in the Iron & Steel Products industry within the Small Cap market-cap bracket.<BR><BR>History:<BR>Usha Martin Ltd was incorporated in an unspecified year and has maintained its status as a prominent player in the wire and wire rope manufacturing sector. The latest quarterly results reported net sales and net profit for June 2026.<BR><BR>Financial Snapshot:<BR>- Net Sales: 1,033 Cr (Quarterly Results - Jun 2026)<BR>- Net Profit: 142 Cr (Quarterly Results - Jun 2026)<BR>- Market-cap: INR 14,826 Cr (Small Cap)<BR><BR>Key Metrics:<BR>- P/E: 28.00<BR>- Industry P/E: 25<BR>- Dividend Yield: 0.76%<BR>- Debt Equity: -0.08<BR>- Return on Equity: 15.08%<BR>- Price to Book: 4.54<BR><BR>Contact Details:<BR>Address: 2A Shakespeare Sarani, Kolkata West Bengal: 700071<BR>Tel: 91-33-39800300<BR>Email: investor@ushamartin.co.in<BR>Website: http://www.ushamartin.com

View full answer

Who are the peers of the Usha Martin?

01-Sep-2026

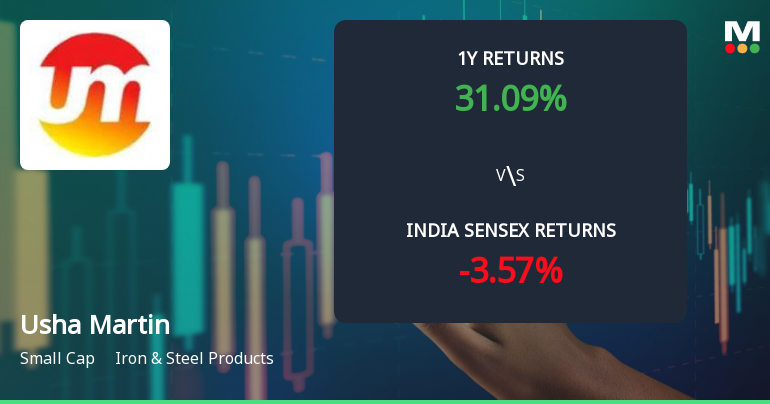
Usha Martin's peers include APL Apollo Tubes, Shyam Metalics, Jindal Saw, Ratnamani Metals, Godawari Power, Gallantt Ispat L, Jayaswal Neco, Mah. Seamless, Technocraf.Inds., and Aeroflex. In terms of performance, Jindal Saw leads with a 1-year return of 56.98%, while Usha Martin has a return of 31.09%.

Peers: The peers of Usha Martin are APL Apollo Tubes, Shyam Metalics, Jindal Saw, Ratnamani Metals, Godawari Power, Gallantt Ispat L, Jayaswal Neco, Mah. Seamless, Technocraf.Inds., and Aeroflex.<BR><BR>Quality Snapshot: Excellent management risk is observed at APL Apollo Tubes, while Good management risk is found at Ratnamani Metals, Godawari Power, Usha Martin, and Technocraf.Inds. Average management risk is present at Shyam Metalics, Jindal Saw, Gallantt Ispat L, Jayaswal Neco, and Mah. Seamless. Excellent growth is noted at APL Apollo Tubes and Gallantt Ispat L, while Good growth is seen at Gallantt Ispat L, and the rest have Below Average growth. Excellent capital structure is exhibited by APL Apollo Tubes, Shyam Metalics, Ratnamani Metals, Godawari Power, Usha Martin, Mah. Seamless, and Aeroflex, while Average capital structure is found at Jindal Saw and Technocraf.Inds., and Below Average capital structure is noted at Jayaswal Neco.<BR><BR>Return Snapshot: Jindal Saw has the highest 1-year return at 56.98%, while Gallantt Ispat L has the lowest at -1.62%, and Usha Martin's 1-year return of 31.09% is higher than Gallantt Ispat L but lower than Jindal Saw. Additionally, Godawari Power and Gallantt Ispat L have negative six-month returns.

View full answer

How big is Usha Martin?

01-Sep-2026

As of 31st August, Usha Martin Ltd has a market capitalization of 14,826.00 Cr, with recent net sales of 3,836.87 Cr and a net profit of 507.04 Cr. The company reported shareholder's funds of 3,301.93 Cr and total assets of 4,202.50 Cr.

As of 31st August, Usha Martin Ltd has a market capitalization of 14,826.00 Cr, categorizing it as a Small Cap company.<BR><BR>In the latest four quarters, Usha Martin reported Net Sales of 3,836.87 Cr and a Net Profit of 507.04 Cr.<BR><BR>For the latest annual period, the company reported Shareholder's Funds of 3,301.93 Cr and Total Assets of 4,202.50 Cr.

View full answer

Should I buy, sell or hold Usha Martin Ltd?

01-Sep-2026

Are Usha Martin Ltd latest results good or bad?

28-Jul-2026

Usha Martin Ltd's latest results show strong revenue growth with record net sales of ₹1,033 crores, up 16.44% year-on-year. However, declining operating margins and a quarter-on-quarter net profit drop raise concerns about profitability sustainability amid rising costs.

Usha Martin Ltd's latest results present a mixed picture. On one hand, the company achieved record net sales of ₹1,033 crores for the quarter, reflecting a 5.49% increase quarter-on-quarter and a robust 16.44% growth year-on-year. This indicates strong demand for its wire and wire rope products and suggests effective market penetration.<BR><BR>However, the performance is tempered by margin compression. The operating margin, excluding other income, decreased to 20.14% from 21.60% in the previous quarter, which raises concerns about the sustainability of profitability amid rising input costs and competitive pressures. Additionally, net profit saw a decline of 3.94% quarter-on-quarter, although it increased by 40.67% year-on-year.<BR><BR>Overall, while the revenue growth is commendable, the sequential decline in profitability and margins indicates challenges that the company must navigate. Investors should keep an eye on how Usha Martin addresses these margin pressures in future quarters.

View full answer

When is the next results date for Usha Martin Ltd?

21-Jul-2026

The next results date for Usha Martin Ltd is 27 July 2026.

The next results date for Usha Martin Ltd is scheduled for 27 July 2026.

View full answer

Is Usha Martin technically bullish or bearish?

21-Nov-2025

As of November 20, 2025, Usha Martin's trend is mildly bullish, supported by bullish MACD and Bollinger Bands, but tempered by mixed KST signals and a mildly bearish weekly trend according to Dow Theory.

As of 20 November 2025, the technical trend for Usha Martin has changed from bullish to mildly bullish. The current stance is mildly bullish, supported by a bullish MACD on both weekly and monthly time frames, and mildly bullish Bollinger Bands on both time frames. However, the KST shows a mixed signal with weekly bullishness and monthly mild bearishness, while Dow Theory indicates a mildly bearish weekly trend against a bullish monthly outlook. The daily moving averages also reflect a mildly bullish sentiment. Overall, the indicators suggest a cautious bullish outlook, tempered by some bearish signals in the longer-term analysis.

View full answer

How has been the historical performance of Usha Martin?

20-Nov-2025

Usha Martin has shown steady growth in net sales and profit from Mar'21 to Mar'25, with net sales increasing from 2,097.28 Cr to 3,474.16 Cr and profit before tax rising from 187.79 Cr to 509.04 Cr, despite some fluctuations in operational costs and a slight decline in consolidated net profit from Mar'24 to Mar'25. Total assets grew significantly from 2,509.10 Cr in Mar'20 to 3,731.46 Cr in Mar'25, while cash flow from operating activities improved from 213.00 Cr to 421.00 Cr.

Answer:<BR>The historical performance of Usha Martin shows a steady growth in net sales and profit over the years, with some fluctuations in specific metrics.<BR><BR>Breakdown:<BR>Usha Martin's net sales increased from 2,097.28 Cr in Mar'21 to 3,474.16 Cr in Mar'25, reflecting a consistent upward trend. Total operating income followed a similar pattern, rising from 2,097.28 Cr in Mar'21 to 3,474.16 Cr in Mar'25. However, the total expenditure also grew, from 1,818.03 Cr in Mar'21 to 2,877.10 Cr in Mar'25, indicating rising operational costs. Operating profit (PBDIT) saw an increase from 279.25 Cr in Mar'21 to 597.06 Cr in Mar'25, although it peaked in Mar'24 at 598.56 Cr. Profit before tax reached 509.04 Cr in Mar'25, up from 187.79 Cr in Mar'21, while profit after tax was 388.51 Cr in Mar'25, compared to 151.35 Cr in Mar'21. The consolidated net profit showed a slight decline from 423.96 Cr in Mar'24 to 407.39 Cr in Mar'25, despite an overall increase from 149.59 Cr in Mar'21. The company's total assets grew significantly from 2,509.10 Cr in Mar'20 to 3,731.46 Cr in Mar'25, while total liabilities also increased from 2,576.39 Cr in Mar'21 to 3,731.46 Cr in Mar'25. Cash flow from operating activities improved from 213.00 Cr in Mar'21 to 421.00 Cr in Mar'25, contributing to a closing cash balance of 260.00 Cr in Mar'25, up from 99.00 Cr in Mar'21.

View full answer

Is Usha Martin overvalued or undervalued?

14-Nov-2025

As of November 13, 2025, Usha Martin is considered overvalued with a valuation grade of "expensive," reflected in its high PE ratio of 32.69 and other premium metrics compared to peers like Tata Steel and Jindal Steel, despite a strong year-to-date return of 19.25%.

As of 13 November 2025, Usha Martin's valuation grade has moved from very expensive to expensive, indicating a slight improvement in perceived value but still reflecting a high valuation. The company is currently considered overvalued. Key ratios include a PE ratio of 32.69, an EV to EBITDA of 22.72, and a Price to Book Value of 4.61, all of which suggest that the stock is priced at a premium compared to its earnings and assets.<BR><BR>In comparison to its peers, Usha Martin's PE ratio is significantly higher than that of Tata Steel at 29.61 and Jindal Steel at 27.84, both of which are categorized as fairly valued. Additionally, the PEG ratio of Usha Martin stands at 0.00, which is notably lower than that of JSW Steel at 2.56, indicating a lack of growth expectations priced into Usha Martin's stock. Despite recent stock performance showing a 19.25% return year-to-date compared to the Sensex's 8.11%, the high valuation metrics suggest that Usha Martin may not sustain such performance levels moving forward.

View full answer

Who are the top shareholders of the Usha Martin?

06-Jun-2025

The top shareholders of Usha Martin include promoters holding the largest share at 13.48%, institutional investors with 22.61% (including mutual funds at 8.36% and FIIs at 14.25%), and individual investors who collectively own 18.25%. The highest public shareholder is India Opportunities Growth Fund Ltd - Pinewood Strategy with a 5.33% stake.

The top shareholders of Usha Martin include a mix of promoters, institutional investors, and individual shareholders. The majority shareholders are the promoters, with no pledged promoter holdings reported. The promoter with the highest holding is Umil Share & Stock Broking Services Ltd., which holds 13.48% of the shares. <BR><BR>In terms of institutional investors, mutual funds hold 8.36% across 21 schemes, while foreign institutional investors (FIIs) hold 14.25% through 120 different entities. The highest public shareholder is India Opportunities Growth Fund Ltd - Pinewood Strategy, which has a stake of 5.33%. Additionally, individual investors collectively hold 18.25% of the company's shares.

View full answer

Has Usha Martin declared dividend?

06-Jun-2025

Yes, Usha Martin Ltd has declared a dividend of 275% (₹2.75 per share) with an ex-date of August 6, 2024. Despite recent short-term price declines, the company has shown strong long-term total returns, particularly over the past 3 to 5 years.

Usha Martin Ltd has declared a dividend.<BR><BR>Dividend Details:<BR>- Percentage announced: 275%<BR>- Amount per share: 2.75<BR>- Ex-date: 06 Aug 24<BR><BR>Dividend Yield: 0.9%<BR><BR>Total Returns by Period:<BR>In the last 6 months, the price return was -25.09%, with a dividend return of 0%, resulting in a total return of -25.09%.<BR><BR>Over the past year, the price return was -14.33%, with a dividend return of 0.74%, leading to a total return of -13.59%.<BR><BR>In the 2-year period, the price return was 22.52%, with a dividend return of 1.84%, culminating in a total return of 24.36%.<BR><BR>For the 3-year period, the price return was 155.96%, with a dividend return of 6.74%, resulting in a total return of 162.7%.<BR><BR>In the last 4 years, the price return was 514.46%, with a dividend return of 12.38%, leading to a total return of 526.84%.<BR><BR>Over the 5-year period, the price return was 1783.08%, with a dividend return of 37.66%, resulting in a total return of 1820.74%.<BR><BR>Overall, Usha Martin has declared a substantial dividend, which reflects positively in the long-term total returns, especially over the 3, 4, and 5-year periods, despite recent short-term declines in price returns.

View full answer
iScoreScore
Click here to find our call on this stock
Strong Sell
Sell
Hold
Buy
Strong Buy

Dashboard

1

High Management Efficiency with a high ROE of 16.43%

 
2

Company has a Debt to Equity ratio (avg) of 0.08 times

 
3

The company has declared Positive results for the last 4 consecutive quarters

4

High Institutional Holdings at 30.35%

5

Market Beating Performance

stock-summaryMojo Parameters

Mojo Parameters

Loading Valuation Snapshot...

Stock DNA

stock-summary
Industry

Iron & Steel Products

stock-summary
Market cap

INR 15,335 Cr (Small Cap)

stock-summary
P/E

28.00

stock-summary
Industry P/E

25

stock-summary
Dividend Yield

0.75%

stock-summary
Debt Equity

-0.08

stock-summary
Return on Equity

15.08%

stock-summary
Price to Book

4.64

Revenue and Profits:
Net Sales:
1,033 Cr
(Quarterly Results - Jun 2026)
Net Profit:
142 Cr
stock-summaryTotal Returns
Total Returns (Price + Dividend) stock-summary
Dividend Yield (0.75%)
TimePeriod
Price Return
Dividend Return
Total Return
3 Months
2.28%
0.72%
3.0%
6 Months
19.54%
0.89%
20.43%
1 Year
31.47%
0.98%
32.45%
2 Years
50.32%
1.88%
52.2%
3 Years
40.5%
2.77%
43.27%
4 Years
266.1%
9.52%
275.62%
5 Years
644.93%
17.40%
662.33%

Latest dividend: 3.75 per share ex-dividend date: Aug-13-2026

Risk Adjusted Returns v/s stock-summary
Returns Beta
Icon
Beta has not been calculated since enough price history is not available
stock-summaryNews & Corporate Actions

News

Announcements stock-summary

Usha Martin Limited - Other General Purpose

26-Nov-2019 | Source : NSE

Usha Martin Limited has submitted to the Exchange a copy of Disclosure of Related Party transactions under Regulation 23(9) of SEBI (Listing Obligations and Disclosure Requirements) Regulations, 2015 for the half year ended September 30, 2019.

Usha Martin Limited - Updates

01-Nov-2019 | Source : NSE

Usha Martin Limited has informed the Exchange regarding 'Copy of the advertisement published in English and regional newspaper (Bengali) on 1st November,2019 relating to Board Meeting to be held on Saturday, 9th November, 2019.'.

Shareholders meeting

21-Sep-2019 | Source : NSE

Usha Martin Limited has submitted the Exchange a copy Srutinizers report of Annual General Meeting held on September 21, 2019. Further, the company has informed the Exchange regarding voting results.

Corporate Actions stock-summary

stock-summary
BOARD MEETING

No Upcoming Board Meetings

stock-summary
DIVIDEND

Usha Martin Ltd has declared 375% dividend, ex-date: 13 Aug 26

stock-summary
SPLITS

Usha Martin Ltd has announced 1:5 stock split, ex-date: 29 Aug 07

stock-summary
BONUS

No Bonus history available

stock-summary
RIGHTS

No Rights history available

stock-summaryKey Factors

Quality key factors stock-summary

Factor
Value
Sales Growth (5y)
10.43%
EBIT Growth (5y)
19.51%
EBIT to Interest (avg)
19.97
Debt to EBITDA (avg)
0.77
Net Debt to Equity (avg)
-0.08
Sales to Capital Employed (avg)
1.20
Tax Ratio
23.29%
Dividend Payout Ratio
22.47%
Pledged Shares
0
Institutional Holding
30.35%
ROCE (avg)
18.24%
ROE (avg)
16.43%

Valuation key factors

Factor
Value
P/E Ratio
28
Industry P/E
25
Price to Book Value
4.64
EV to EBIT
23.31
EV to EBITDA
19.63
EV to Capital Employed
4.94
EV to Sales
3.93
PEG Ratio
0.85
Dividend Yield
0.75%
ROCE (Latest)
19.28%
ROE (Latest)
15.08%

Technicals key factors

Indicator
Weekly
Monthly
MACD
Mildly Bearish
Bullish
RSI
No Signal
No Signal
Bollinger Bands
Bullish
Bullish
Moving Averages
Bullish (Daily)
KST
Mildly Bearish
Bullish
Dow Theory
Mildly Bearish
No Trend
OBV
Mildly Bearish
No Trend
stock-summary Technical Indicator Scale: Bearish, Mildly Bearish, Sideways, Mildly Bullish, Bullish  Turned 
stock-summaryShareholding
Shareholding Snapshot : Jun 2026stock-summary
Shareholding Compare (%holding) stock-summary
Majority shareholders

Promoters

Pledged Promoter Holdings

None

Mutual Funds

Held by 26 Schemes (12.14%)

FIIs

Held by 141 FIIs (15.1%)

Promoter with highest holding

Umil Share And Stock Broking Services Ltd (13.48%)

Highest Public shareholder

India Opportunities Growth Fund Ltd - Pinewood Strategy (5.11%)

Individual Investors Holdings

16.05%

stock-summaryFinancial
[
  {
    "link": "quarterly",
    "btn_text": "All Quarterly Results",
    "header": "Quarterly Results Snapshot (Consolidated) - Jun'26 - QoQ",
    "rhs": [
      {
        "prefix": "Net Sales ",
        "suffix": "QoQ Growth in quarter ended Jun 2026 is 5.49% vs 6.78% in Mar 2026",
        "dir": -1
      },
      {
        "prefix": "Consolidated Net Profit ",
        "suffix": "QoQ Growth in quarter ended Jun 2026 is -3.94% vs 37.42% in Mar 2026",
        "dir": -1
      }
    ],
    "table": {
      "header": [
        "Jun'26",
        "Mar'26",
        "Change(%)"
      ],
      "body": [
        {
          "field": "Net Sales",
          "val1": "1,033.00",
          "val2": "979.26",
          "chgp": "5.49%",
          "chgp_class": "positive"
        },
        {
          "field": "Operating Profit (PBDIT) excl Other Income",
          "val1": "208.01",
          "val2": "211.53",
          "chgp": "-1.66%",
          "chgp_class": "negative"
        },
        {
          "field": "Interest",
          "val1": "3.90",
          "val2": "3.52",
          "chgp": "10.80%",
          "chgp_class": "negative"
        },
        {
          "field": "Exceptional Items",
          "val1": "0.00",
          "val2": "-10.61",
          "chgp": "100.00%",
          "chgp_class": "positive"
        },
        {
          "field": "Consolidate Net Profit",
          "val1": "141.98",
          "val2": "147.80",
          "chgp": "-3.94%",
          "chgp_class": "negative"
        },
        {
          "field": "Operating Profit Margin (Excl OI)",
          "val1": "20.14%",
          "val2": "21.60%",
          "chgp": "-1.46%",
          "chgp_class": "negative"
        }
      ]
    }
  },
  {
    "link": "half-yearly",
    "btn_text": "All Half Yearly Results",
    "header": "Half Yearly Results Snapshot (Consolidated) - Sep'25",
    "rhs": [
      {
        "prefix": "Net Sales ",
        "suffix": " Growth in half year ended Sep 2025 is 4.50% vs 7.41% in Sep 2024",
        "dir": -1
      },
      {
        "prefix": "Consolidated Net Profit ",
        "suffix": " Growth in half year ended Sep 2025 is -1.49% vs 1.73% in Sep 2024",
        "dir": -1
      }
    ],
    "table": {
      "header": [
        "Sep'25",
        "Sep'24",
        "Change(%)"
      ],
      "body": [
        {
          "field": "Net Sales",
          "val1": "1,794.75",
          "val2": "1,717.54",
          "chgp": "4.50%",
          "chgp_class": "positive"
        },
        {
          "field": "Operating Profit (PBDIT) excl Other Income",
          "val1": "317.61",
          "val2": "314.81",
          "chgp": "0.89%",
          "chgp_class": "positive"
        },
        {
          "field": "Interest",
          "val1": "11.34",
          "val2": "14.34",
          "chgp": "-20.92%",
          "chgp_class": "positive"
        },
        {
          "field": "Exceptional Items",
          "val1": "-17.80",
          "val2": "0.00",
          "chgp": "",
          "chgp_class": "neutral"
        },
        {
          "field": "Consolidate Net Profit",
          "val1": "210.64",
          "val2": "213.83",
          "chgp": "-1.49%",
          "chgp_class": "negative"
        },
        {
          "field": "Operating Profit Margin (Excl OI)",
          "val1": "17.70%",
          "val2": "18.33%",
          "chgp": "-0.63%",
          "chgp_class": "negative"
        }
      ]
    }
  },
  {
    "link": "nine-monthly",
    "btn_text": "All Nine Monthly Results",
    "header": "Nine Monthly Results Snapshot (Consolidated) - Dec'25",
    "rhs": [
      {
        "prefix": "Net Sales ",
        "suffix": "YoY Growth in nine months ended Dec 2025 is 5.19% vs 7.59% in Dec 2024",
        "dir": -1
      },
      {
        "prefix": "Consolidated Net Profit ",
        "suffix": "YoY Growth in nine months ended Dec 2025 is 3.85% vs -3.56% in Dec 2024",
        "dir": 1
      }
    ],
    "table": {
      "header": [
        "Dec'25",
        "Dec'24",
        "Change(%)"
      ],
      "body": [
        {
          "field": "Net Sales",
          "val1": "2,711.80",
          "val2": "2,578.08",
          "chgp": "5.19%",
          "chgp_class": "positive"
        },
        {
          "field": "Operating Profit (PBDIT) excl Other Income",
          "val1": "493.55",
          "val2": "457.49",
          "chgp": "7.88%",
          "chgp_class": "positive"
        },
        {
          "field": "Interest",
          "val1": "16.11",
          "val2": "23.01",
          "chgp": "-29.99%",
          "chgp_class": "positive"
        },
        {
          "field": "Exceptional Items",
          "val1": "-31.15",
          "val2": "0.00",
          "chgp": "",
          "chgp_class": "neutral"
        },
        {
          "field": "Consolidate Net Profit",
          "val1": "318.19",
          "val2": "306.40",
          "chgp": "3.85%",
          "chgp_class": "positive"
        },
        {
          "field": "Operating Profit Margin (Excl OI)",
          "val1": "18.20%",
          "val2": "17.75%",
          "chgp": "0.45%",
          "chgp_class": "positive"
        }
      ]
    }
  },
  {
    "link": "annual",
    "btn_text": "All Annual Results",
    "header": "Annual Results Snapshot (Consolidated) - Mar'26",
    "rhs": [
      {
        "prefix": "Net Sales ",
        "suffix": "YoY Growth in year ended Mar 2026 is 6.24% vs 7.72% in Mar 2025",
        "dir": -1
      },
      {
        "prefix": "Consolidated Net Profit ",
        "suffix": "YoY Growth in year ended Mar 2026 is 14.38% vs -3.91% in Mar 2025",
        "dir": 1
      }
    ],
    "table": {
      "header": [
        "Mar'26",
        "Mar'25",
        "Change(%)"
      ],
      "body": [
        {
          "field": "Net Sales",
          "val1": "3,691.06",
          "val2": "3,474.16",
          "chgp": "6.24%",
          "chgp_class": "positive"
        },
        {
          "field": "Operating Profit (PBDIT) excl Other Income",
          "val1": "705.08",
          "val2": "597.06",
          "chgp": "18.09%",
          "chgp_class": "positive"
        },
        {
          "field": "Interest",
          "val1": "19.63",
          "val2": "29.55",
          "chgp": "-33.57%",
          "chgp_class": "positive"
        },
        {
          "field": "Exceptional Items",
          "val1": "-41.76",
          "val2": "0.00",
          "chgp": "",
          "chgp_class": "neutral"
        },
        {
          "field": "Consolidate Net Profit",
          "val1": "465.99",
          "val2": "407.39",
          "chgp": "14.38%",
          "chgp_class": "positive"
        },
        {
          "field": "Operating Profit Margin (Excl OI)",
          "val1": "19.10%",
          "val2": "17.19%",
          "chgp": "1.91%",
          "chgp_class": "positive"
        }
      ]
    }
  }
]

Quarterly Results Snapshot (Consolidated) - Jun'26 - QoQstock-summary

Jun'26
Mar'26
Change(%)
Net Sales
1,033.00
979.26
5.49%
Operating Profit (PBDIT) excl Other Income
208.01
211.53
-1.66%
Interest
3.90
3.52
10.80%
Exceptional Items
0.00
-10.61
100.00%
Consolidate Net Profit
141.98
147.80
-3.94%
Operating Profit Margin (Excl OI)
20.14%
21.60%
-1.46%
Values in Rs Cr.
Direction Arrows
Net Sales

QoQ Growth in quarter ended Jun 2026 is 5.49% vs 6.78% in Mar 2026

Direction Arrows
Consolidated Net Profit

QoQ Growth in quarter ended Jun 2026 is -3.94% vs 37.42% in Mar 2026

Half Yearly Results Snapshot (Consolidated) - Sep'25stock-summary

Sep'25
Sep'24
Change(%)
Net Sales
1,794.75
1,717.54
4.50%
Operating Profit (PBDIT) excl Other Income
317.61
314.81
0.89%
Interest
11.34
14.34
-20.92%
Exceptional Items
-17.80
0.00
Consolidate Net Profit
210.64
213.83
-1.49%
Operating Profit Margin (Excl OI)
17.70%
18.33%
-0.63%
Values in Rs Cr.
Direction Arrows
Net Sales

Growth in half year ended Sep 2025 is 4.50% vs 7.41% in Sep 2024

Direction Arrows
Consolidated Net Profit

Growth in half year ended Sep 2025 is -1.49% vs 1.73% in Sep 2024

Nine Monthly Results Snapshot (Consolidated) - Dec'25stock-summary

Dec'25
Dec'24
Change(%)
Net Sales
2,711.80
2,578.08
5.19%
Operating Profit (PBDIT) excl Other Income
493.55
457.49
7.88%
Interest
16.11
23.01
-29.99%
Exceptional Items
-31.15
0.00
Consolidate Net Profit
318.19
306.40
3.85%
Operating Profit Margin (Excl OI)
18.20%
17.75%
0.45%
Values in Rs Cr.
Direction Arrows
Net Sales

YoY Growth in nine months ended Dec 2025 is 5.19% vs 7.59% in Dec 2024

Direction Arrows
Consolidated Net Profit

YoY Growth in nine months ended Dec 2025 is 3.85% vs -3.56% in Dec 2024

Annual Results Snapshot (Consolidated) - Mar'26stock-summary

Mar'26
Mar'25
Change(%)
Net Sales
3,691.06
3,474.16
6.24%
Operating Profit (PBDIT) excl Other Income
705.08
597.06
18.09%
Interest
19.63
29.55
-33.57%
Exceptional Items
-41.76
0.00
Consolidate Net Profit
465.99
407.39
14.38%
Operating Profit Margin (Excl OI)
19.10%
17.19%
1.91%
Values in Rs Cr.
Direction Arrows
Net Sales

YoY Growth in year ended Mar 2026 is 6.24% vs 7.72% in Mar 2025

Direction Arrows
Consolidated Net Profit

YoY Growth in year ended Mar 2026 is 14.38% vs -3.91% in Mar 2025

stock-summaryCompany CV
About Usha Martin Ltd stock-summary
stock-summary
Usha Martin Ltd
Small Cap
Iron & Steel Products
Usha Martin Limited is a leading producer of speciality steel and one of the largest wire rope manufacturers globally. The Company is engaged in the business of Wire and Wire ropes - Manufacture and sale of steel wires, strands, wire ropes, cord, related accessories, wire drawing and allied machine, etc. They are having six manufacturing facilities in Ranchi, Hoshiarpur, Silvassa, Dubai, Bangkok and the United Kingdom.
Company Coordinates stock-summary
Company Details
2A Shakespeare Sarani , Kolkata West Bengal : 700071
stock-summary
Tel: 91-33-39800300
stock-summary
investor@ushamartin.co.in
Registrar Details
MCS Share Transfer Agent Ltd., Formerly MCS Ltd., 12/1/5, Monoharpukar Road, Kolkata