
Compare UVS Hospitality with Similar Stocks
Stock DNA
Non Banking Financial Company (NBFC)
INR 376 Cr (Micro Cap)
23.00
20
0.00%
0.07
8.46%
1.98
Total Returns (Price + Dividend) 
UVS Hospitality for the last several years.
Risk Adjusted Returns v/s
Returns Beta

News
UVS Hospitality & Services Ltd is Rated Sell
UVS Hospitality & Services Ltd is rated 'Sell' by MarketsMOJO, with this rating last updated on 13 May 2026. However, the analysis and financial metrics discussed here reflect the stock's current position as of 08 June 2026, providing investors with the latest insights into its performance and outlook.
Read full news articleAre UVS Hospitality & Services Ltd latest results good or bad?
The latest financial results for UVS Hospitality & Services Ltd reveal a mixed operational performance. In Q4 FY26, the company reported a net profit of ₹2.35 crores, which reflects a significant decline from the previous quarter's profit of ₹6.21 crores, indicating challenges in maintaining profitability despite revenue growth. The revenue for the quarter reached ₹37.25 crores, marking a 2.31% increase from the prior quarter, which is a slowdown compared to the 8.49% growth seen in Q3 FY26. The company's PAT margin has contracted sharply to 6.31% from 17.06% in the previous quarter, highlighting issues with cost management and operational efficiency. The operating profit margin also fell to 14.39%, down from 21.72%, further emphasizing the strain on profitability metrics. Additionally, employee costs have risen, accounting for a larger percentage of revenue, which suggests that the company is facing risin...
Read full news article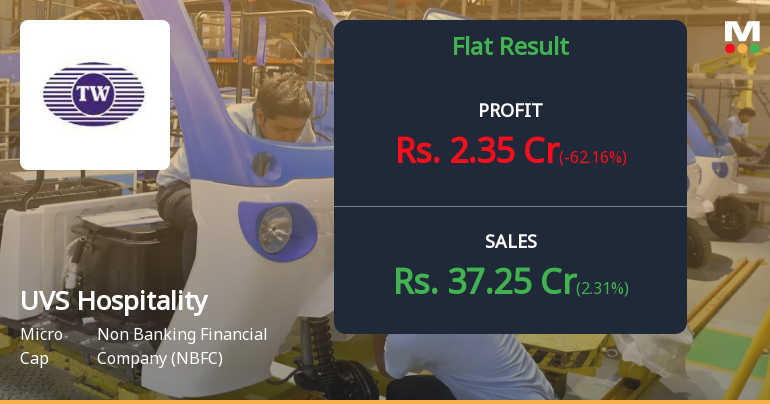
UVS Hospitality Q4 FY26: Profitability Plunges as Margin Pressures Mount
UVS Hospitality & Services Ltd., the Kolkata-based food and beverage services company, reported a sharp 62.16% quarter-on-quarter decline in consolidated net profit for Q4 FY26, dropping to ₹2.35 crores from ₹6.21 crores in Q3 FY26. Whilst revenue growth remained resilient at ₹37.25 crores—up 2.31% sequentially and 23.51% year-on-year—profitability margins contracted sharply, with PAT margin plummeting to 6.31% from 17.06% in the previous quarter. The micro-cap stock, with a market capitalisation of ₹392.77 crores, fell 7.28% following the results announcement, closing at ₹103.00 on June 1, 2026.
Read full news article Announcements
Announcement under Regulation 30 (LODR)-Change in Registered Office Address
03-Jun-2026 | Source : BSEThe Stock Exchange and the stakeholders are requested to take note of the intimation pertaining to the change in registered office of the Company.
Announcement under Regulation 30 (LODR)-Newspaper Publication
01-Jun-2026 | Source : BSEPlease find attached the newspaper clippings for the audited financial results for the quarter and year ended 31st March 2026.
Statement Of Deviation Or Variation In The Use Of Proceeds For The Quarter Ended 31St March 2026.
30-May-2026 | Source : BSEPlease find attached the statement of deviation or variation in the use of proceeds for the quarter ended 31st March 2026.
Corporate Actions

No Upcoming Board Meetings

No Dividend history available

No Splits history available

No Bonus history available

No Rights history available
Quality key factors
Valuation key factors
Technicals key factors
 Technical Indicator Scale: Bearish, Mildly Bearish, Sideways, Mildly Bullish, Bullish Turned
 Shareholding Snapshot : Mar 2026
Shareholding Compare (%holding)
Non Institution
None
Held by 0 Schemes
Held by 0 FIIs
Utkarsh Chandrakant Vartak (36.45%)
Sachin Dilip Nanche (16.02%)
27.49%
Quarterly Results Snapshot (Consolidated) - Mar'26 - QoQ

QoQ Growth in quarter ended Mar 2026 is 2.31% vs 8.49% in Dec 2025
QoQ Growth in quarter ended Mar 2026 is -62.16% vs -2.51% in Dec 2025
Half Yearly Results Snapshot (Consolidated) - Sep'25

Growth in half year ended Sep 2025 is 39.35% vs 0.00% in Sep 2024
Growth in half year ended Sep 2025 is 7.11% vs 7,711.11% in Sep 2024
Nine Monthly Results Snapshot (Consolidated) - Dec'25
YoY Growth in nine months ended Dec 2025 is 31.97% vs 0.00% in Dec 2024
YoY Growth in nine months ended Dec 2025 is 13.65% vs 7,456.25% in Dec 2024
Annual Results Snapshot (Consolidated) - Mar'26
YoY Growth in year ended Mar 2026 is 29.47% vs 8,141.46% in Mar 2025
YoY Growth in year ended Mar 2026 is 0.63% vs 39,875.00% in Mar 2025
About UVS Hospitality & Services Ltd

Company Coordinates


