
Compare V R Woodart with Similar Stocks
Dashboard
With a Negative Book Value, the company has a Weak Long Term Fundamental Strength
- Poor long term growth as Net Sales has grown by an annual rate of % and Operating profit at 0% over the last 5 years
- High Debt Company with a Debt to Equity ratio (avg) at 0 times
Flat results in Dec 25
Risky - Negative EBITDA
Despite the size of the company, domestic mutual funds hold only 0% of the company
Stock DNA
Tyres & Rubber Products
INR 516 Cr (Micro Cap)
NA (Loss Making)
33
0.00%
-1.00
1.77%
-177.57
Total Returns (Price + Dividend) 
V R Woodart for the last several years.
Risk Adjusted Returns v/s
Returns Beta

News
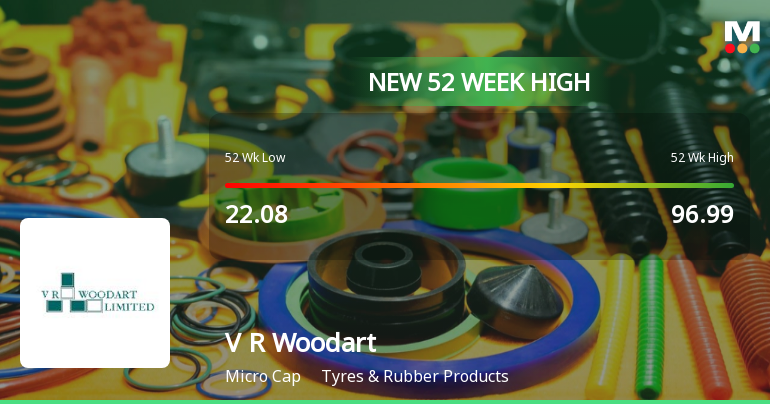
Broad-Based Technical Strength Lifts V R Woodart Ltd to 52-Week High of Rs 178.8
From a low of Rs 22.08 to a new peak of Rs 178.8, V R Woodart Ltd has surged an extraordinary 391.75% over the past year, far outpacing the Sensex’s modest 1.71% gain. This remarkable rally culminated today with the stock hitting its all-time high, driven by a confluence of strong technical signals and sustained price momentum.
Read full news article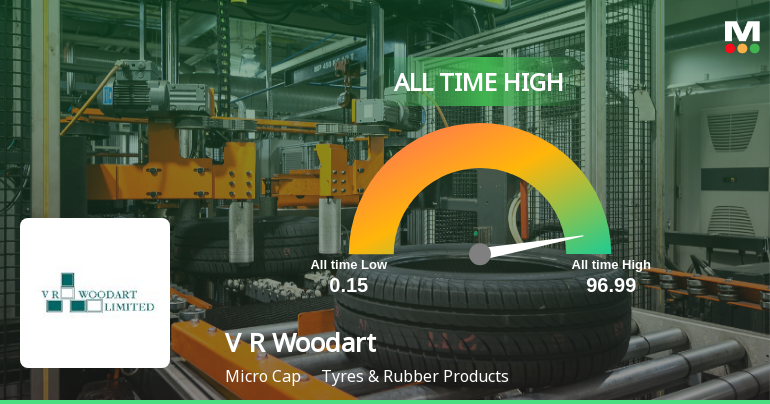

V R Woodart Ltd is Rated Sell
V R Woodart Ltd is rated 'Sell' by MarketsMOJO, with this rating last updated on 27 January 2025. However, the analysis and financial metrics discussed here reflect the company’s current position as of 15 April 2026, providing investors with an up-to-date perspective on the stock’s fundamentals, valuation, financial trend, and technical outlook.
Read full news article Announcements
Disclosures under Reg. 29(2) of SEBI (SAST) Regulations 2011
01-Apr-2026 | Source : BSEThe Exchange has received the disclosure under Regulation 29(2) of SEBI (Substantial Acquisition of Shares & Takeovers) Regulations 2011 for Minal Patil
Disclosures under Reg. 18(6) of SEBI (SAST) Regulations 2011
01-Apr-2026 | Source : BSEThe Exchange has received the disclosure under Regulation 18(6) of SEBI (Substantial Acquisition of Shares & Takeovers) Regulations 2011 for Minal Patil
Disclosures under Reg. 29(2) of SEBI (SAST) Regulations 2011
01-Apr-2026 | Source : BSEThe Exchange has received the disclosure under Regulation 29(2) of SEBI (Substantial Acquisition of Shares & Takeovers) Regulations 2011 for Faze Three Ltd & PACs
Corporate Actions

No Upcoming Board Meetings

No Dividend history available

No Splits history available

No Bonus history available

No Rights history available
Quality key factors
Valuation key factors
Technicals key factors
 Technical Indicator Scale: Bearish, Mildly Bearish, Sideways, Mildly Bullish, Bullish Turned
 Shareholding Snapshot : Dec 2025
Shareholding Compare (%holding)
Non Institution
None
Held by 0 Schemes
Held by 0 FIIs
Faze Three Limited (6.04%)
Altra Tek Finishing Private Limited (21.15%)
33.31%
Quarterly Results Snapshot (Standalone) - Dec'25 - QoQ
QoQ Growth in quarter ended Dec 2025 is 0.00% vs 0.00% in Sep 2025

QoQ Growth in quarter ended Dec 2025 is 55.56% vs 28.95% in Sep 2025
Half Yearly Results Snapshot (Standalone) - Sep'25
Not Applicable: The company has declared_date for only one period
Not Applicable: The company has declared_date for only one period
Nine Monthly Results Snapshot (Standalone) - Dec'25
YoY Growth in nine months ended Dec 2025 is 0.00% vs 0.00% in Dec 2024

YoY Growth in nine months ended Dec 2025 is -1,000.00% vs 12.50% in Dec 2024
Annual Results Snapshot (Standalone) - Mar'25
YoY Growth in year ended Mar 2025 is 0.00% vs 0.00% in Mar 2024
YoY Growth in year ended Mar 2025 is -44.44% vs 35.71% in Mar 2024
About V R Woodart Ltd

Company Coordinates


