
 Price Point
Compare Vadilal Enterp. with Similar Stocks
ScoreDashboard
With ROCE of 22.8, it has a Expensive valuation with a 12.9 Enterprise value to Capital Employed
- The stock is trading at a discount compared to its peers' average historical valuations
- Over the past year, while the stock has generated a return of 3.58%, its profits have risen by 82.4% ; the PEG ratio of the company is 1.1
Despite the size of the company, domestic mutual funds hold only 0% of the company


 Total Returns
Total Returns (Price + Dividend) 
Latest dividend: 1.5 per share ex-dividend date: Sep-16-2025
Risk Adjusted Returns v/s
Returns Beta
 News & Corporate Actions
News
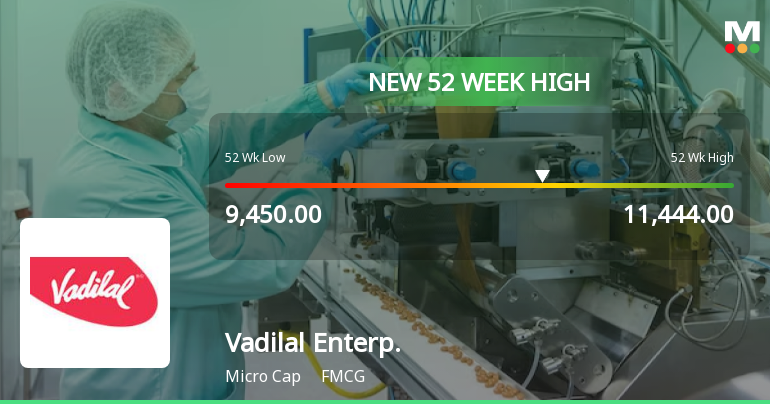
Broad-Based Technical Strength Lifts Vadilal Enterprises Ltd to 52-Week High of Rs 11444
With a decisive surge to Rs 11,444 on 14 Aug 2026, Vadilal Enterprises Ltd has reached a fresh 52-week high, marking a notable milestone in its price momentum. This rally comes amid a backdrop of mixed market conditions and a confluence of technical signals that underscore the stock’s upward trajectory.
Read full news articleAre Vadilal Enterprises Ltd latest results good or bad?
Vadilal Enterprises Ltd's financial results for the quarter ended March 2026 reflect a complex operational landscape. The company reported a net loss of ₹4.22 crores, which, while an improvement from the ₹8.76 crore loss in the same quarter last year, raises concerns about its ongoing profitability, especially during the peak ice cream sales season. On the revenue front, Vadilal experienced a notable growth of 30.16% year-on-year, reaching ₹291.29 crores, indicating strong sales momentum. This growth was further amplified by a sequential increase of 101.01% compared to the previous quarter, showcasing the seasonal nature of its business. However, this robust revenue growth did not translate into profitability, as the operating margin remained at a mere 0.15%, a slight improvement from the negative 3.55% margin reported a year earlier. The company's operational challenges are underscored by rising costs,...
Read full news article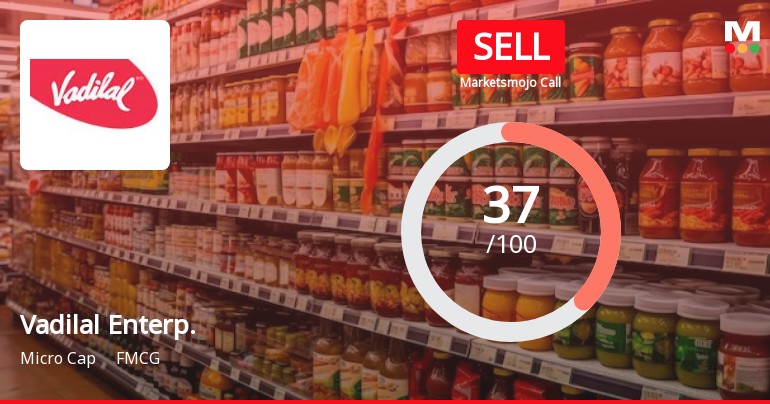
Vadilal Enterprises Ltd is Rated Sell
Vadilal Enterprises Ltd is rated 'Sell' by MarketsMOJO, with this rating last updated on 17 Nov 2025. However, the analysis and financial metrics discussed below reflect the stock's current position as of 09 August 2026, providing investors with an up-to-date view of the company’s fundamentals, valuation, financial trends, and technical outlook.
Read full news article Announcements
Board Meeting Intimation for Meeting To Be Held On August 13 2026
07-Aug-2026 | Source : BSEVadilal Enterprises Ltdhas informed BSE that the meeting of the Board of Directors of the Company is scheduled on 13/08/2026 inter alia to consider and approve Unaudited Standalone Financial Results for the quarter ended June 30 2026
Announcement under Regulation 30 (LODR)-Meeting Updates
05-Aug-2026 | Source : BSEUpdate of Board Meeting held on 05th August2026
Announcement under Regulation 30 (LODR)-Credit Rating
10-Jul-2026 | Source : BSEIntimation regarding Credit Ratings under Regulation 30 of the SEBI (LODR) Regulations 2015
Corporate Actions

No Upcoming Board Meetings

Vadilal Enterprises Ltd has declared 15% dividend, ex-date: 16 Sep 25

No Splits history available

No Bonus history available

No Rights history available
Key FactorsQuality key factors
Valuation key factors
Technicals key factors
 Technical Indicator Scale: Bearish, Mildly Bearish, Sideways, Mildly Bullish, Bullish Turned Shareholding
Shareholding Snapshot : Jun 2026
Shareholding Compare (%holding)
Promoters
None
Held by 0 Schemes
Held by 1 FIIs (0.54%)
Devanshu Laxmanbhai Gandhi (13.99%)
Sanjiv Dhireshbhai Shah (6.94%)
35.87%
FinancialQuarterly Results Snapshot (Standalone) - Jun'26 - YoY
 Compare with Peers
YoY Growth in quarter ended Jun 2026 is 36.18% vs 0.71% in Jun 2025
YoY Growth in quarter ended Jun 2026 is 15.92% vs -30.62% in Jun 2025

Half Yearly Results Snapshot (Standalone) - Sep'25

Growth in half year ended Sep 2025 is 2.90% vs 11.83% in Sep 2024
Growth in half year ended Sep 2025 is -6.13% vs 134.12% in Sep 2024
Nine Monthly Results Snapshot (Standalone) - Dec'25
YoY Growth in nine months ended Dec 2025 is 3.43% vs 10.44% in Dec 2024
YoY Growth in nine months ended Dec 2025 is 1.24% vs -10.72% in Dec 2024
Annual Results Snapshot (Standalone) - Mar'26
YoY Growth in year ended Mar 2026 is 8.77% vs 12.01% in Mar 2025
YoY Growth in year ended Mar 2026 is 82.37% vs -23.70% in Mar 2025
 Company CV
About Vadilal Enterprises Ltd

Company Coordinates










