
Total Returns (Price + Dividend) 
Vaghani Techno for the last several years.
Risk Adjusted Returns v/s
Returns Beta

News

Vaghani Techno-Build Hits New 52-Week High of Rs.147.65, Marking Significant Rally
Vaghani Techno-Build has reached a new 52-week high of Rs.147.65 today, reflecting a strong upward momentum that has seen the stock gain nearly 50% over the past 21 trading sessions. This milestone underscores the stock’s robust performance within the FMCG sector amid a broadly positive market environment.
Read More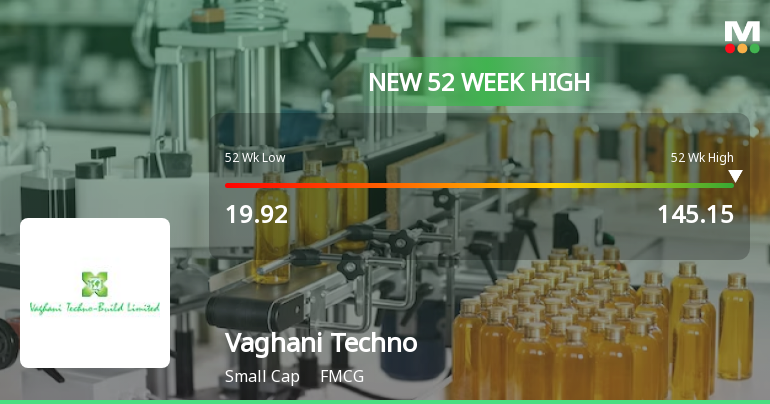
Vaghani Techno-Build Hits New 52-Week High at Rs.145.15
Vaghani Techno-Build, a key player in the FMCG sector, reached a fresh 52-week high of Rs.145.15 today, marking a significant milestone in its stock performance. This new peak reflects sustained momentum as the stock continues to trade above all major moving averages, underscoring its recent strength in the market.
Read More
Vaghani Techno-Build Hits New 52-Week High at Rs.142.35
Vaghani Techno-Build, a player in the FMCG sector, reached a significant milestone today by touching a new 52-week high of Rs.142.35. This achievement marks a notable phase of momentum for the stock, reflecting sustained gains over the past month and a half.
Read More Announcements
Announcement under Regulation 30 (LODR)-Conversion of Securities
11-Dec-2025 | Source : BSECONVERSION OF 5600000 WARRANT INTO EQUITY SHARES TO PROMOTER AND PROMOTER GROUP.
Announcement under Regulation 30 (LODR)-Change of Company Name
02-Dec-2025 | Source : BSEAs pre Captioned subject we hereby informed you that Central Processing Centre has approved the change of name from Vaghani Techno-build Limited to Emrock Corporation Limited with effect from December 1 2025 Kindly take on the record.
Disclosures under Reg. 29(2) of SEBI (SAST) Regulations 2011
21-Nov-2025 | Source : BSEThe Exchange has received the disclosure under Regulation 29(2) of SEBI (Substantial Acquisition of Shares & Takeovers) Regulations 2011 for Meet Govind Vaghani
Corporate Actions

No Upcoming Board Meetings

No Dividend history available

No Splits history available

No Bonus history available

No Rights history available
Quality key factors
Valuation key factors
Technicals key factors
 Technical Indicator Scale: Bearish, Mildly Bearish, Sideways, Mildly Bullish, Bullish Turned
 Shareholding Snapshot : Sep 2025
Shareholding Compare (%holding)
Promoters
None
Held by 0 Schemes
Held by 0 FIIs
None
Pragnesh Manikantbhai Joshi (3.25%)
21.63%
Quarterly Results Snapshot (Standalone) - Sep'25 - QoQ

QoQ Growth in quarter ended Sep 2025 is 200.00% vs -70.00% in Jun 2025
QoQ Growth in quarter ended Sep 2025 is 150.00% vs -37.50% in Jun 2025
Half Yearly Results Snapshot (Standalone) - Sep'25
Growth in half year ended Sep 2025 is 0.00% vs 0.00% in Sep 2024
Growth in half year ended Sep 2025 is 3,300.00% vs 107.14% in Sep 2024
Nine Monthly Results Snapshot (Standalone) - Dec'24
YoY Growth in nine months ended Dec 2024 is 0.00% vs 0.00% in Dec 2023
YoY Growth in nine months ended Dec 2024 is 116.67% vs -400.00% in Dec 2023
Annual Results Snapshot (Standalone) - Mar'25
YoY Growth in year ended Mar 2025 is 0.00% vs 0.00% in Mar 2024
YoY Growth in year ended Mar 2025 is 270.00% vs -266.67% in Mar 2024
About Vaghani Techno-Build Ltd

Company Coordinates


