
Total Returns (Price + Dividend) 
Vaghani Techno for the last several years.
Risk Adjusted Returns v/s
Returns Beta

News
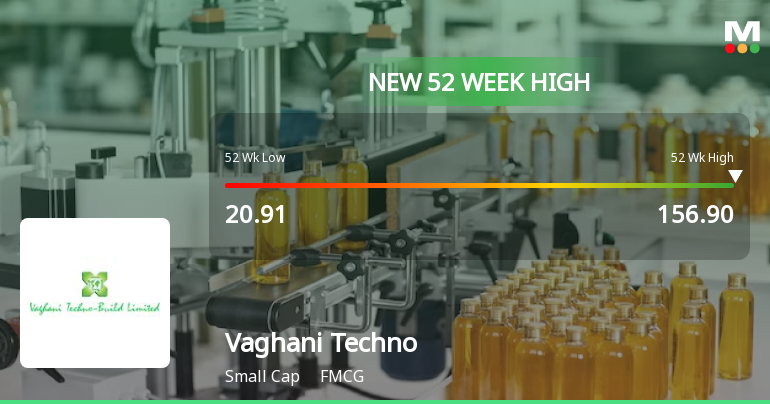
Vaghani Techno-Build Hits New 52-Week High of Rs.156.9 Marking Strong Momentum
Vaghani Techno-Build, a key player in the FMCG sector, reached a significant milestone today by hitting a new 52-week high of Rs.156.9. This achievement underscores the stock's robust momentum, reflecting sustained gains over the past three weeks and a notable outperformance relative to its sector peers.
Read More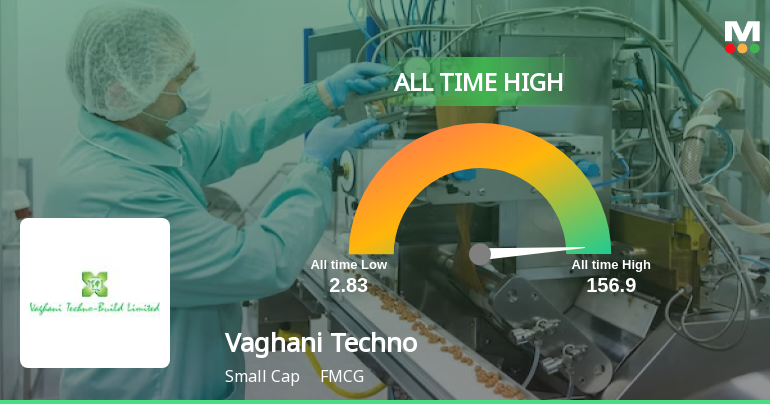
Vaghani Techno-Build Stock Hits All-Time High at Rs.156.9
Vaghani Techno-Build, a prominent player in the FMCG sector, reached a new all-time high of Rs.156.9 today, marking a significant milestone in its market journey. The stock’s performance over recent weeks has demonstrated notable strength, outpacing sector and benchmark indices consistently.
Read More
Vaghani Techno-Build Hits New 52-Week High of Rs.153.85 Marking Significant Milestone
Vaghani Techno-Build, a key player in the FMCG sector, reached a new 52-week high today, touching Rs.153.85. This milestone reflects a sustained upward momentum, with the stock demonstrating notable strength amid a mixed market backdrop.
Read More Announcements
Disclosures under Reg. 29(1) of SEBI (SAST) Regulations 2011
15-Dec-2025 | Source : BSEThe Exchange has received the disclosure under Regulation 29(1) of SEBI (Substantial Acquisition of Shares & Takeovers) Regulations 2011 for Arjunkumar Patel
Announcement under Regulation 30 (LODR)-Allotment
15-Dec-2025 | Source : BSEAllotment of 5000000 Equity share of Rs. 10 each pursuant to Conversation of 5000000 warrants as per details attached.
Disclosures under Reg. 29(2) of SEBI (SAST) Regulations 2011
15-Dec-2025 | Source : BSEThe Exchange has received the disclosure under Regulation 29(2) of SEBI (Substantial Acquisition of Shares & Takeovers) Regulations 2011 for Parth Patel
Corporate Actions

No Upcoming Board Meetings

No Dividend history available

No Splits history available

No Bonus history available

No Rights history available
Quality key factors
Valuation key factors
Technicals key factors
 Technical Indicator Scale: Bearish, Mildly Bearish, Sideways, Mildly Bullish, Bullish Turned
 Shareholding Snapshot : Sep 2025
Shareholding Compare (%holding)
Promoters
None
Held by 0 Schemes
Held by 0 FIIs
None
Pragnesh Manikantbhai Joshi (3.25%)
21.63%
Quarterly Results Snapshot (Standalone) - Sep'25 - QoQ

QoQ Growth in quarter ended Sep 2025 is 200.00% vs -70.00% in Jun 2025
QoQ Growth in quarter ended Sep 2025 is 150.00% vs -37.50% in Jun 2025
Half Yearly Results Snapshot (Standalone) - Sep'25
Growth in half year ended Sep 2025 is 0.00% vs 0.00% in Sep 2024
Growth in half year ended Sep 2025 is 3,300.00% vs 107.14% in Sep 2024
Nine Monthly Results Snapshot (Standalone) - Dec'24
YoY Growth in nine months ended Dec 2024 is 0.00% vs 0.00% in Dec 2023
YoY Growth in nine months ended Dec 2024 is 116.67% vs -400.00% in Dec 2023
Annual Results Snapshot (Standalone) - Mar'25
YoY Growth in year ended Mar 2025 is 0.00% vs 0.00% in Mar 2024
YoY Growth in year ended Mar 2025 is 270.00% vs -266.67% in Mar 2024
About Vaghani Techno-Build Ltd

Company Coordinates


