
Compare Valiant Laborato with Similar Stocks
Dashboard
Weak Long Term Fundamental Strength with an average Return on Equity (ROE) of 0%
- Poor long term growth as Net Sales has grown by an annual rate of 14.20% over the last 5 years
- Company's ability to service its debt is weak with a poor EBIT to Interest (avg) ratio of -5.65
With ROE of -1.1, it has a Very Expensive valuation with a 1.1 Price to Book Value
Below par performance in long term as well as near term
Stock DNA
Pharmaceuticals & Biotechnology
INR 339 Cr (Micro Cap)
NA (Loss Making)
37
0.00%
0.04
-1.06%
1.09
Total Returns (Price + Dividend) 
Valiant Laborato for the last several years.
Risk Adjusted Returns v/s
Returns Beta

News
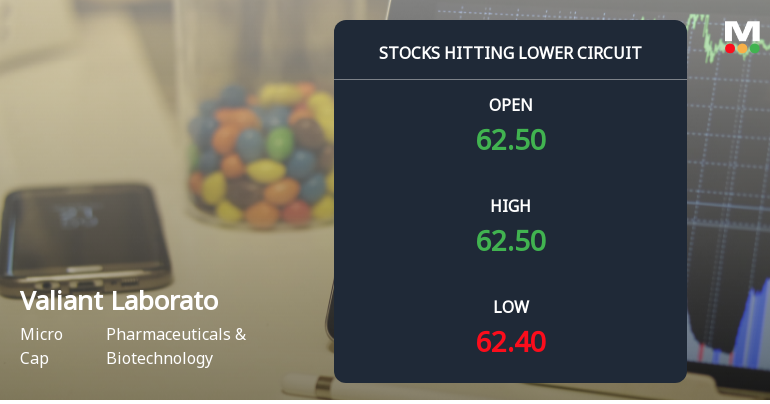
Valiant Laboratories Ltd Locks at Lower Circuit With 5% Loss — Sellers Queue, No Buyers in Sight
At Rs 59.15, sellers were still queuing — but there were no buyers willing to take the other side. Valiant Laboratories Ltd locked at its lower circuit of 5% on 24 Jul 2026, with unfilled sell orders and a frozen price.
Read full news article
Valiant Laboratories Ltd is Rated Strong Sell
Valiant Laboratories Ltd is rated Strong Sell by MarketsMOJO, with this rating last updated on 13 July 2026. However, the analysis and financial metrics discussed here reflect the stock’s current position as of 14 July 2026, providing investors with the most up-to-date insight into the company’s performance and outlook.
Read full news article
Valiant Laboratories Ltd Downgraded to Strong Sell Amid Weak Fundamentals and Bearish Technicals
Valiant Laboratories Ltd, a micro-cap player in the Pharmaceuticals & Biotechnology sector, has been downgraded from a Sell to a Strong Sell rating by MarketsMOJO as of 2 July 2026. The revision reflects deteriorating technical indicators, expensive valuation metrics, weak long-term fundamentals, and a faltering financial trend despite recent quarterly gains. This comprehensive analysis explores the four key parameters that triggered the downgrade and what it means for investors.
Read full news article Announcements
Compliances-Certificate under Reg. 74 (5) of SEBI (DP) Regulations 2018
13-Jul-2026 | Source : BSEfor quarter ended June 30 2026.
Closure of Trading Window
26-Jun-2026 | Source : BSEClosure of Trading Window for declaration of Financial Results for the quarter ended June 30 2026.
Intimation Under Regulation 30 Of The SEBI (Listing Obligations And Disclosure Requirements) Regulations 2015
30-May-2026 | Source : BSEPlease find enclosed
Corporate Actions

No Upcoming Board Meetings

No Dividend history available

No Splits history available

No Bonus history available

Valiant Laboratories Ltd has announced 1:4 rights issue, ex-date: 18 Jul 25
Quality key factors
Valuation key factors
Technicals key factors
 Technical Indicator Scale: Bearish, Mildly Bearish, Sideways, Mildly Bullish, Bullish Turned
 Shareholding Snapshot : Jun 2026
Shareholding Compare (%holding)
Promoters
None
Held by 0 Schemes
Held by 0 FIIs
Dhanvallabh Ventures Llp (46.84%)
Anil Vishanji Dedhia (1.84%)
18.91%
Quarterly Results Snapshot (Consolidated) - Mar'26 - QoQ

QoQ Growth in quarter ended Mar 2026 is 75.33% vs 13.55% in Dec 2025
QoQ Growth in quarter ended Mar 2026 is 124.93% vs -3,630.00% in Dec 2025
Half Yearly Results Snapshot (Consolidated) - Sep'25
Growth in half year ended Sep 2025 is 130.50% vs -63.62% in Sep 2024
Growth in half year ended Sep 2025 is 138.48% vs -203.75% in Sep 2024
Nine Monthly Results Snapshot (Consolidated) - Dec'25
YoY Growth in nine months ended Dec 2025 is 92.47% vs -50.10% in Dec 2024
YoY Growth in nine months ended Dec 2025 is -73.79% vs -285.90% in Dec 2024
Annual Results Snapshot (Consolidated) - Mar'26
YoY Growth in year ended Mar 2026 is 78.04% vs -26.74% in Mar 2025
YoY Growth in year ended Mar 2026 is -48.64% vs -787.50% in Mar 2025
About Valiant Laboratories Ltd

Company Coordinates


