
Compare Vallabh Steels with Similar Stocks
Dashboard
With a Negative Book Value, the company has a Weak Long Term Fundamental Strength
- Poor long term growth as Net Sales has grown by an annual rate of % and Operating profit at 0% over the last 5 years
- The company has a negative book value of Rs 23.24 crore
Flat results in Mar 26
Risky - Negative EBITDA
Stock DNA
Iron & Steel Products
INR 4 Cr (Micro Cap)
NA (Loss Making)
24
0.00%
-1.99
26.46%
-0.17
Total Returns (Price + Dividend) 
Vallabh Steels for the last several years.
Risk Adjusted Returns v/s
Returns Beta

News
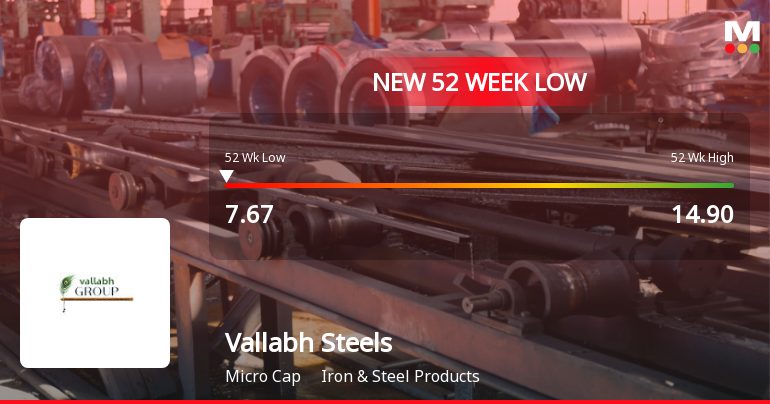
Markets Rally, But Vallabh Steels Ltd Sinks to 52-Week Low in Stock-Specific Sell-Off
Despite a broadly positive market backdrop, Vallabh Steels Ltd has plunged to a fresh 52-week low of Rs 7.67 on 29 Jul 2026, marking a continuation of its recent downward trajectory amid sector gains.
Read full news article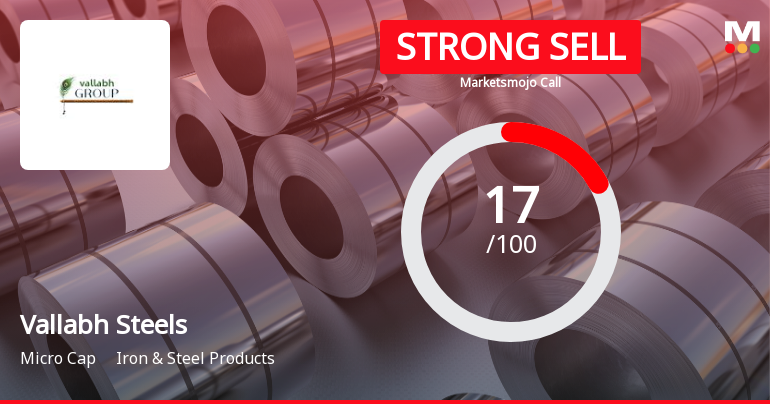
Vallabh Steels Ltd Downgraded to Strong Sell Amid Technical and Fundamental Weaknesses
Vallabh Steels Ltd, a micro-cap player in the Iron & Steel Products sector, has been downgraded from a Sell to a Strong Sell rating as of 19 June 2026. This revision reflects a deterioration in its technical indicators, weak financial fundamentals, and challenging valuation metrics, despite the stock’s recent market-beating returns over the past year.
Read full news article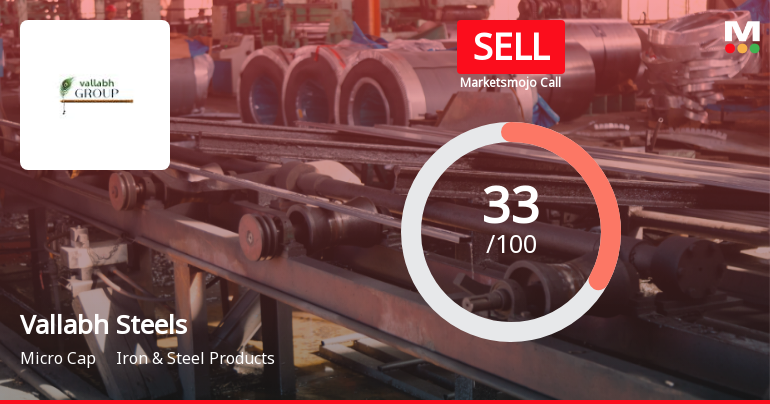
Vallabh Steels Ltd Upgraded to Sell on Technical Improvements Despite Weak Fundamentals
Vallabh Steels Ltd, a micro-cap player in the Iron & Steel Products sector, has seen its investment rating upgraded from Strong Sell to Sell as of 8 June 2026. This change reflects a nuanced shift in the company’s technical outlook despite persistent fundamental challenges, signalling cautious optimism among market analysts.
Read full news article Announcements
Compliances-Certificate under Reg. 74 (5) of SEBI (DP) Regulations 2018
15-Jul-2026 | Source : BSEPlease find enclosed herewith certificate under Reg 74(5) of SEBI (DP) Regulations 1996 for the quarter ended 30th June 2026.
Closure of Trading Window
30-Jun-2026 | Source : BSEIntimation of closure of trading window for the quarter ended 30th June 2026
Announcement under Regulation 30 (LODR)-Newspaper Publication
30-May-2026 | Source : BSEPlease find herewith the newspaper publication.
Corporate Actions

No Upcoming Board Meetings

No Dividend history available

No Splits history available

No Bonus history available

No Rights history available
Quality key factors
Valuation key factors
Technicals key factors
 Technical Indicator Scale: Bearish, Mildly Bearish, Sideways, Mildly Bullish, Bullish Turned
 Shareholding Snapshot : Jun 2026
Shareholding Compare (%holding)
Promoters
None
Held by 0 Schemes
Held by 0 FIIs
Adhinath Investments Private Ltd (16.13%)
Vardhman Industries Ltd. (5.96%)
31.68%
Quarterly Results Snapshot (Standalone) - Mar'26 - QoQ
QoQ Growth in quarter ended Mar 2026 is 0.00% vs 0.00% in Dec 2025

QoQ Growth in quarter ended Mar 2026 is 0.00% vs 3.33% in Dec 2025
Half Yearly Results Snapshot (Standalone) - Sep'25
Growth in half year ended Sep 2025 is 0.00% vs 0.00% in Sep 2024
Growth in half year ended Sep 2025 is 15.71% vs 27.84% in Sep 2024
Nine Monthly Results Snapshot (Standalone) - Dec'25
YoY Growth in nine months ended Dec 2025 is 0.00% vs 0.00% in Dec 2024
YoY Growth in nine months ended Dec 2025 is 16.19% vs 25.00% in Dec 2024
Annual Results Snapshot (Standalone) - Mar'26
YoY Growth in year ended Mar 2026 is 0.00% vs 0.00% in Mar 2025
YoY Growth in year ended Mar 2026 is 17.02% vs 21.23% in Mar 2025
About Vallabh Steels Ltd

Company Coordinates


