
Compare Valson Industrie with Similar Stocks
Dashboard
Weak Long Term Fundamental Strength with an average Return on Capital Employed (ROCE) of 2.54%
- Poor long term growth as Net Sales has grown by an annual rate of 12.03% and Operating profit at 17.72% over the last 5 years
- Low ability to service debt as the company has a high Debt to EBITDA ratio of 3.87 times
Flat results in Mar 26
Stock DNA
Garments & Apparels
INR 22 Cr (Micro Cap)
43.00
23
0.00%
0.47
1.77%
0.79
Total Returns (Price + Dividend) 
Latest dividend: 1 per share ex-dividend date: Sep-20-2019
Risk Adjusted Returns v/s
Returns Beta

News
Are Valson Industries Ltd latest results good or bad?
Valson Industries Ltd's latest financial results for Q4 FY26 present a complex picture of the company's operational performance. The company reported net sales of ₹28.92 crores, reflecting a quarter-on-quarter increase of 6.68% from ₹27.11 crores in the previous quarter. This sequential growth suggests some stabilization in demand after a series of declining revenues. However, when compared to the same quarter last year, there is a notable year-on-year decline of 13.28% from ₹33.35 crores, indicating ongoing challenges in maintaining market share within the competitive textile processing sector. In terms of profitability, Valson Industries achieved a net profit of ₹0.24 crores, which is a 50% increase quarter-on-quarter from ₹0.16 crores. Despite this sequential improvement, the year-on-year performance shows a significant decline of 53.85% from ₹0.52 crores in Q4 FY25. The operating margin for the quarter...
Read full news article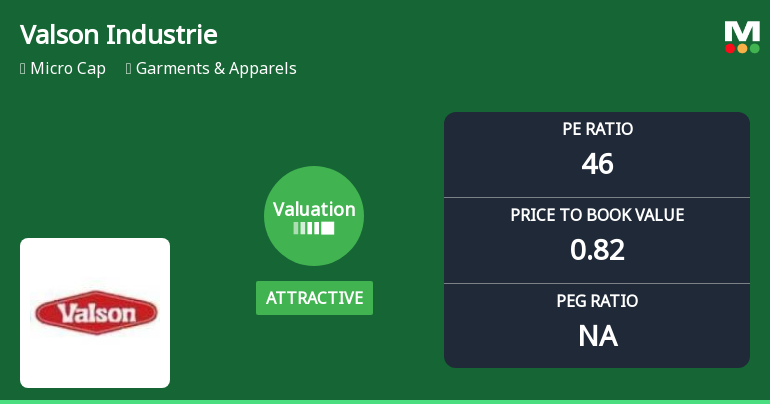
Valson Industries Ltd: Valuation Shifts Signal Renewed Price Attractiveness Amid Mixed Financial Metrics
Valson Industries Ltd, a micro-cap player in the Garments & Apparels sector, has witnessed a notable shift in its valuation parameters, moving from a very attractive to an attractive rating. Despite a challenging earnings environment and modest returns, the stock’s price-to-earnings (P/E) and price-to-book value (P/BV) ratios suggest a more compelling entry point relative to its historical and peer benchmarks.
Read full news article
Valson Industries Q4 FY26: Marginal Recovery Masks Deeper Structural Challenges
Valson Industries Ltd., a micro-cap textile processor specialising in texturising, twisting, and dyeing of polyester and cotton yarns, reported a modest sequential recovery in Q4 FY26 with net profit of ₹0.24 crores, marking a 50.00% quarter-on-quarter improvement from ₹0.16 crores in Q3 FY26. However, the year-on-year comparison reveals a concerning 53.85% decline from ₹0.52 crores in Q4 FY25, underscoring persistent operational headwinds that have plagued the company throughout the fiscal year. With a market capitalisation of just ₹21.00 crores and the stock trading at ₹29.78 following a 6.21% gain on June 1, 2026, investors face a challenging decision between attractive valuation metrics and deteriorating fundamental performance.
Read full news article Announcements
Board Meeting Outcome for Outcome Of Board Meeting
30-May-2026 | Source : BSEOutcome of Board Meeting
Outcome Of Board Meeting
30-May-2026 | Source : BSEEnclosed is outcome of Board Meeting held on 30-05-2026
Financial Results For FY 31.03.2026
30-May-2026 | Source : BSEEnclosed is the Audited Annual Financial Results for the financial year ended 31-Mar-2026
Corporate Actions

No Upcoming Board Meetings

Valson Industries Ltd has declared 10% dividend, ex-date: 20 Sep 19

No Splits history available

Valson Industries Ltd has announced 1:1 bonus issue, ex-date: 07 Dec 09

No Rights history available
Quality key factors
Valuation key factors
Technicals key factors
 Technical Indicator Scale: Bearish, Mildly Bearish, Sideways, Mildly Bullish, Bullish Turned
 Shareholding Snapshot : Mar 2026
Shareholding Compare (%holding)
Promoters
None
Held by 0 Schemes
Held by 0 FIIs
Suresh N. Mutreja (21.92%)
Mahendrabhai Chandulal Dharu Huf (3.03%)
26.88%
Quarterly Results Snapshot (Standalone) - Mar'26 - QoQ

QoQ Growth in quarter ended Mar 2026 is 6.68% vs -0.77% in Dec 2025

QoQ Growth in quarter ended Mar 2026 is 50.00% vs 1,500.00% in Dec 2025
Half Yearly Results Snapshot (Standalone) - Sep'25
Growth in half year ended Sep 2025 is -5.82% vs -12.02% in Sep 2024
Growth in half year ended Sep 2025 is 400.00% vs -96.83% in Sep 2024
Nine Monthly Results Snapshot (Standalone) - Dec'25
YoY Growth in nine months ended Dec 2025 is -14.22% vs 0.35% in Dec 2024
YoY Growth in nine months ended Dec 2025 is 188.89% vs -88.75% in Dec 2024
Annual Results Snapshot (Standalone) - Mar'26
YoY Growth in year ended Mar 2026 is -13.98% vs 4.80% in Mar 2025
YoY Growth in year ended Mar 2026 is -21.31% vs -37.76% in Mar 2025
About Valson Industries Ltd

Company Coordinates


