
Compare Vapi Enterprise with Similar Stocks
Dashboard
Weak Long Term Fundamental Strength with a -3.51% CAGR growth in Net Sales over the last 5 years
- Company's ability to service its debt is weak with a poor EBIT to Interest (avg) ratio of 1.39
- The company has been able to generate a Return on Equity (avg) of 3.53% signifying low profitability per unit of shareholders funds
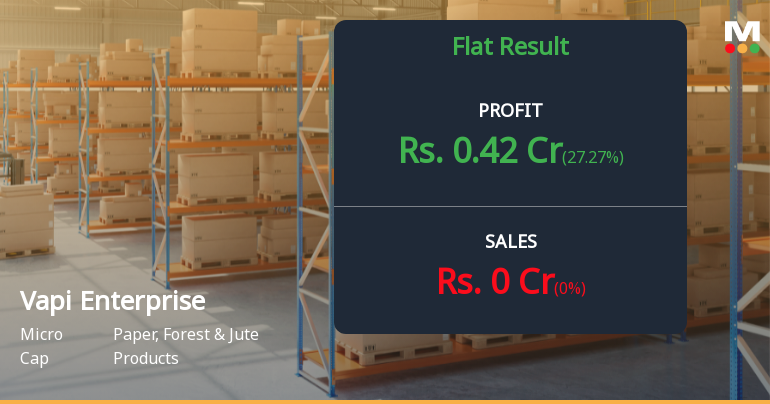
Flat results in Mar 26
With ROE of 4.1, it has a Very Expensive valuation with a 0.6 Price to Book Value
Below par performance in long term as well as near term
Stock DNA
Paper, Forest & Jute Products
INR 23 Cr (Micro Cap)
15.00
8
0.00%
-0.94
4.08%
0.63
Total Returns (Price + Dividend) 
Vapi Enterprise for the last several years.
Risk Adjusted Returns v/s
Returns Beta

News
Vapi Enterprise Q4 FY26: Micro-Cap Paper Company Struggles with Zero Revenue, Stock Down 30% YoY
Vapi Enterprise Ltd., a micro-cap company in the Paper, Forest & Jute Products sector, reported its Q4 FY26 results with net profit of ₹0.42 crores, marking a 27.27% quarter-on-quarter increase but a 16.67% year-on-year increase. With a market capitalisation of just ₹22.00 crores and zero revenue generation for the quarter, the company's transformation from a paper manufacturer to a lease rental and job work services provider continues to raise concerns amongst investors. The stock has declined 30.49% over the past year, significantly underperforming both the Sensex and its sector.
Read full news articleAre Vapi Enterprise Ltd latest results good or bad?
Vapi Enterprise Ltd's latest financial results reveal a complex picture of its operational performance. In Q3 FY26, the company reported a net profit of ₹0.33 crores, which reflects a year-on-year decline of 21.43%. Notably, this marks the lowest quarterly net profit in the recent seven-quarter period, raising concerns about the sustainability of its current business model. The company has not generated any sales revenue for seven consecutive quarters, a significant shift since it transitioned from a paper manufacturing business to a lease rental and job work service provider. Despite the absence of revenue, Vapi Enterprise managed to generate an operating profit of ₹0.45 crores, although this represents a decline from previous quarters, indicating potential margin pressures or reduced activity levels in its service offerings. The return on equity (ROE) stands at a modest 3.96%, which is below average and ...
Read full news article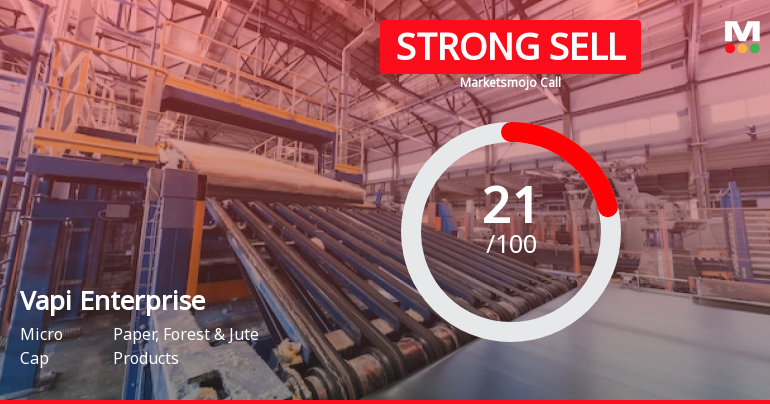
Vapi Enterprise Ltd is Rated Strong Sell
Vapi Enterprise Ltd is rated Strong Sell by MarketsMOJO, with this rating last updated on 26 Aug 2025. However, the analysis and financial metrics discussed here reflect the company’s current position as of 15 May 2026, providing investors with the latest insights into its fundamentals, valuation, financial trends, and technical outlook.
Read full news article Announcements
Results-Financial Results For The Year Ended 31St March 2026
30-May-2026 | Source : BSEStandalone Audited Financial Statements for the year ended 3st March 2026 Auditors Report with Modified Opinion Annexure-I in the prescribed Format with Statement of Impact of Audit Qualifications (For Audit Report with Modified Opinion)
Announcement under Regulation 30 (LODR)-Newspaper Publication
28-May-2026 | Source : BSEPursuant to Regulation 47 enclosed herewith copies of Newspaper Publication for the Audited Financial Results of the Company for the quarter and financial year ended 31st March 2026 which are considered and approved at the Board Meeting held on May 26th 2026 and published in newspapers ie Financial Express and Pratahkal
Corporate Actions

No Upcoming Board Meetings

No Dividend history available

No Splits history available

No Bonus history available

No Rights history available
Quality key factors
Valuation key factors
Technicals key factors
 Technical Indicator Scale: Bearish, Mildly Bearish, Sideways, Mildly Bullish, Bullish Turned
 Shareholding Snapshot : Mar 2026
Shareholding Compare (%holding)
Non Institution
None
Held by 0 Schemes
Held by 0 FIIs
Manoj Ramanbhai Patel (4.91%)
Madhav Haridas Asher (7.76%)
56.4%
Quarterly Results Snapshot (Standalone) - Mar'26 - QoQ
QoQ Growth in quarter ended Mar 2026 is 0.00% vs 0.00% in Dec 2025

QoQ Growth in quarter ended Mar 2026 is 27.27% vs -5.71% in Dec 2025
Half Yearly Results Snapshot (Standalone) - Sep'25
Growth in half year ended Sep 2025 is 0.00% vs -100.00% in Sep 2024
Growth in half year ended Sep 2025 is 38.89% vs 22.73% in Sep 2024
Nine Monthly Results Snapshot (Standalone) - Dec'25
YoY Growth in nine months ended Dec 2025 is 0.00% vs -100.00% in Dec 2024

YoY Growth in nine months ended Dec 2025 is 12.50% vs 54.84% in Dec 2024
Annual Results Snapshot (Standalone) - Mar'26
YoY Growth in year ended Mar 2026 is 0.00% vs -100.00% in Mar 2025
YoY Growth in year ended Mar 2026 is 12.88% vs 59.04% in Mar 2025
About Vapi Enterprise Ltd

Company Coordinates


