
Compare Vardhman Special with Similar Stocks
Dashboard
Strong ability to service debt as the company has a low Debt to EBITDA ratio of 0.56 times
Poor long term growth as Net Sales has grown by an annual rate of 13.36% and Operating profit at 12.81% over the last 5 years
Positive results in Mar 26
With ROE of 9.6, it has a Very Expensive valuation with a 2.3 Price to Book Value
Majority shareholders : Promoters
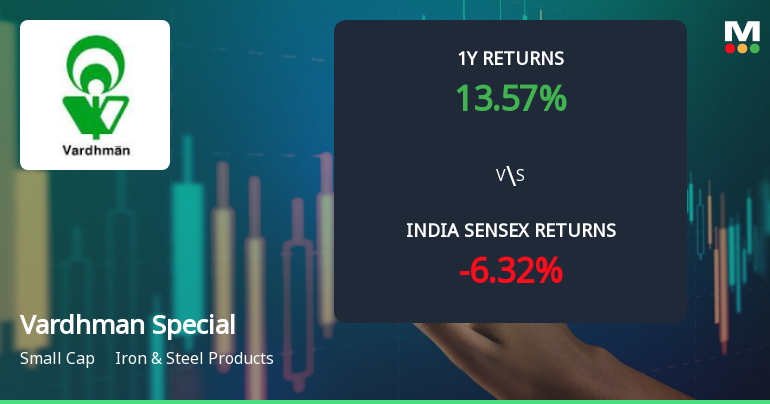
Market Beating performance in long term as well as near term
Stock DNA
Iron & Steel Products
INR 2,858 Cr (Small Cap)
31.00
26
1.00%
-0.09
9.55%
2.26
Total Returns (Price + Dividend) 
Latest dividend: 3 per share ex-dividend date: Sep-12-2025
Risk Adjusted Returns v/s
Returns Beta

News
Vardhman Special Steels Ltd Sees Bullish Momentum Shift Amid Technical Upgrades
Vardhman Special Steels Ltd has witnessed a notable shift in its technical momentum, moving from a mildly bullish stance to a more confident bullish trend. This change is underpinned by a combination of positive signals from key technical indicators such as MACD, Bollinger Bands, and moving averages, signalling renewed investor interest in this small-cap iron and steel products company amid a recovering market environment.
Read full news article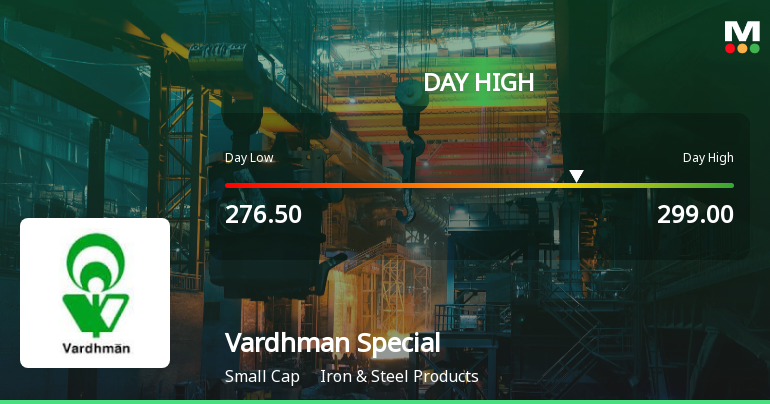
Vardhman Special Steels Ltd Surges 7.31% to Day's High of Rs 295.35 — Outperforms Sector by 7.37 Percentage Points
The Sensex declined by 0.38% on 13 Jul 2026, while Vardhman Special Steels Ltd surged 7.31%, marking a remarkable 7.37 percentage-point outperformance over its Iron & Steel Products sector. This sharp single-session gain rewrites the short-term narrative for the small-cap stock, which has been steadily advancing over the past three days.
Read full news article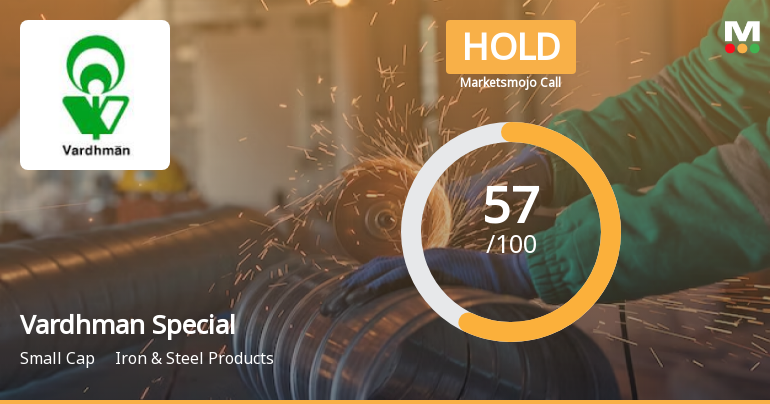
Vardhman Special Steels Ltd is Rated Hold by MarketsMOJO
Vardhman Special Steels Ltd is rated 'Hold' by MarketsMOJO, with this rating last updated on 15 June 2026. However, the analysis and financial metrics discussed here reflect the stock's current position as of 08 July 2026, providing investors with the latest insights into its performance and valuation.
Read full news article Announcements
Vardhman Special Steels Limited - Press Release
05-Nov-2019 | Source : NSEVardhman Special Steels Limited has informed the Exchange regarding a press release dated November 05, 2019, titled "Media Release on financial results of the Company for the quarter/ half- year ended 30th September, 2019".
Vardhman Special Steels Limited - Memorandum of Understanding/Agreement
04-Nov-2019 | Source : NSEVardhman Special Steels Limited has informed the Exchange about Memorandum of Understanding/Agreements.Pursuant to Regulation 30 of the Listing Regulations read with the SEBI Circular, and further to our intimation dated August 10, 2019, we hereby inform you that Vardhman Special Steels Limited ( Company ) has entered into a letter agreement dated November 2, 2019 for amendment to the share subscription and investment agreement dated August 10, 2019 executed by the Company with Aichi Steel Corporation ( Amendment Agreement ).
Vardhman Special Steels Limited - Analysts/Institutional Investor Meet/Con. Call Updates
01-Nov-2019 | Source : NSEVardhman Special Steels Limited has informed the Exchange regarding Analysts/Institutional Investor Meet/Con. Call Updates
Corporate Actions

22 Jul 2026

Vardhman Special Steels Ltd has declared 30% dividend, ex-date: 12 Sep 25

No Splits history available

Vardhman Special Steels Ltd has announced 1:1 bonus issue, ex-date: 26 May 23

Vardhman Special Steels Ltd has announced 2:3 rights issue, ex-date: 07 Apr 17
Quality key factors
Valuation key factors
Technicals key factors
 Technical Indicator Scale: Bearish, Mildly Bearish, Sideways, Mildly Bullish, Bullish Turned
 Shareholding Snapshot : Jun 2026
Shareholding Compare (%holding)
Promoters
None
Held by 6 Schemes (3.23%)
Held by 27 FIIs (0.55%)
Vardhman Textiles Limited (20.08%)
Aichi Steel Corporation (24.85%)
16.68%
Quarterly Results Snapshot (Standalone) - Mar'26 - QoQ

QoQ Growth in quarter ended Mar 2026 is 6.36% vs -0.40% in Dec 2025
QoQ Growth in quarter ended Mar 2026 is 1.16% vs -2.81% in Dec 2025
Half Yearly Results Snapshot (Standalone) - Sep'25

Growth in half year ended Sep 2025 is -4.80% vs 10.31% in Sep 2024
Growth in half year ended Sep 2025 is 4.93% vs 40.16% in Sep 2024
Nine Monthly Results Snapshot (Standalone) - Dec'25
YoY Growth in nine months ended Dec 2025 is -2.98% vs 9.36% in Dec 2024
YoY Growth in nine months ended Dec 2025 is 20.02% vs 24.68% in Dec 2024
Annual Results Snapshot (Standalone) - Mar'26
YoY Growth in year ended Mar 2026 is -0.57% vs 6.20% in Mar 2025
YoY Growth in year ended Mar 2026 is 31.08% vs 1.59% in Mar 2025
About Vardhman Special Steels Ltd

Company Coordinates


