
Compare Varroc Engineer with Similar Stocks
Dashboard
Low ability to service debt as the company has a high Debt to EBITDA ratio of 1.11 times
- Low ability to service debt as the company has a high Debt to EBITDA ratio of 1.11 times
Healthy long term growth as Operating profit has grown by an annual rate 24.57%
The company has declared Positive results for the last 4 consecutive quarters
With ROCE of 20.2, it has a Fair valuation with a 3.9 Enterprise value to Capital Employed
Falling Participation by Institutional Investors
Stock DNA
Auto Components & Equipments
INR 8,898 Cr (Small Cap)
31.00
36
0.18%
0.38
15.97%
4.89
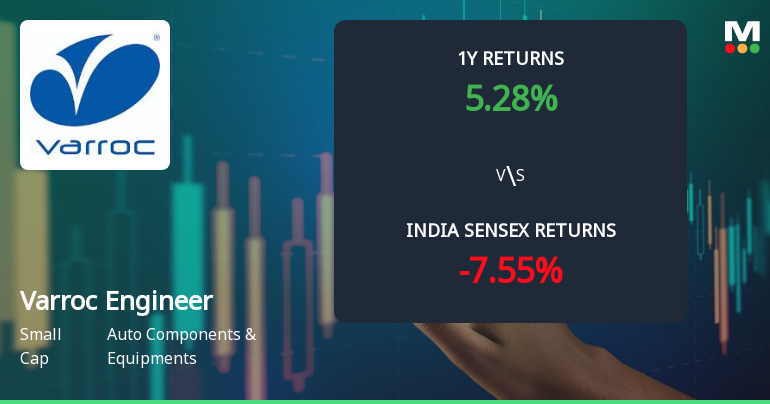
Total Returns (Price + Dividend) 
Latest dividend: 1 per share ex-dividend date: Aug-08-2025
Risk Adjusted Returns v/s
Returns Beta

News
Varroc Engineering Ltd Technical Momentum Shifts Signal Mild Bullish Outlook
Varroc Engineering Ltd has exhibited a notable shift in its technical momentum, moving from a sideways trend to a mildly bullish stance. This change is supported by a mixed but improving set of technical indicators, including MACD, Bollinger Bands, and the KST oscillator, suggesting cautious optimism for investors in the auto components sector.
Read full news article
Varroc Engineering Ltd is Rated Hold by MarketsMOJO
Varroc Engineering Ltd is rated 'Hold' by MarketsMOJO, with this rating last updated on 04 May 2026. However, the analysis and financial metrics discussed here reflect the stock's current position as of 13 June 2026, providing investors with the latest insights into the company’s performance and outlook.
Read full news article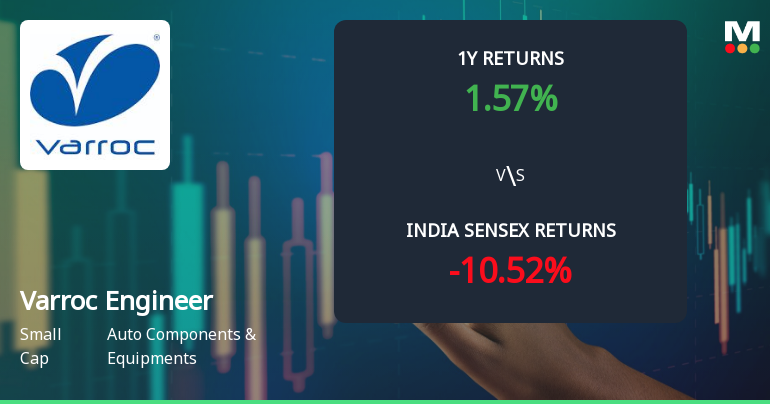
Varroc Engineering Ltd Technical Momentum Shifts Amid Mixed Indicator Signals
Varroc Engineering Ltd, a small-cap player in the Auto Components & Equipments sector, has experienced a notable shift in its technical momentum, moving from a mildly bullish stance to a sideways trend. Despite a recent downgrade in its technical trend, the stock’s mixed signals across key indicators such as MACD, RSI, and moving averages suggest a complex outlook for investors navigating this evolving landscape.
Read full news article Announcements
Announcement under Regulation 30 (LODR)-Analyst / Investor Meet - Intimation
08-Jun-2026 | Source : BSEInvestor Meets
Announcement under Regulation 30 (LODR)-Press Release / Media Release
03-Jun-2026 | Source : BSEPress Release
Varroc Engineering Limitedhas Entered Into A Strategic Cooperation Arrangement
03-Jun-2026 | Source : BSEStrategic arrangement
Corporate Actions

No Upcoming Board Meetings

Varroc Engineering Ltd has declared 100% dividend, ex-date: 08 Aug 25

No Splits history available

No Bonus history available

No Rights history available
Quality key factors
Valuation key factors
Technicals key factors
 Technical Indicator Scale: Bearish, Mildly Bearish, Sideways, Mildly Bullish, Bullish Turned
 Shareholding Snapshot : Mar 2026
Shareholding Compare (%holding)
Promoters
None
Held by 9 Schemes (9.98%)
Held by 83 FIIs (4.45%)
Tarang Jain (39.75%)
Hdfc Trustee Company Limited-hdfc Flexi Cap Fund (7.37%)
7.33%
Quarterly Results Snapshot (Consolidated) - Mar'26 - QoQ

QoQ Growth in quarter ended Mar 2026 is 3.52% vs 3.63% in Dec 2025

QoQ Growth in quarter ended Mar 2026 is 773.01% vs -116.90% in Dec 2025
Half Yearly Results Snapshot (Consolidated) - Sep'25
Growth in half year ended Sep 2025 is 6.41% vs 7.78% in Sep 2024
Growth in half year ended Sep 2025 is 88.48% vs 1.85% in Sep 2024
Nine Monthly Results Snapshot (Consolidated) - Dec'25
YoY Growth in nine months ended Dec 2025 is 7.72% vs 8.57% in Dec 2024
YoY Growth in nine months ended Dec 2025 is 283.05% vs -91.34% in Dec 2024
Annual Results Snapshot (Consolidated) - Mar'26
YoY Growth in year ended Mar 2026 is 9.03% vs 7.97% in Mar 2025
YoY Growth in year ended Mar 2026 is 267.52% vs -88.36% in Mar 2025
About Varroc Engineering Ltd

Company Coordinates


