
Compare Vascon Engineers with Similar Stocks
Dashboard
Poor Management Efficiency with a low ROCE of 7.50%
- The company has been able to generate a Return on Capital Employed (avg) of 7.50% signifying low profitability per unit of total capital (equity and debt)
With a fall in PBT of -43.18%, the company declared Very Negative results in Mar 26
Despite the size of the company, domestic mutual funds hold only 0% of the company
Below par performance in long term as well as near term
Total Returns (Price + Dividend) 
Latest dividend: 0.2 per share ex-dividend date: Aug-21-2023
Risk Adjusted Returns v/s
Returns Beta

News
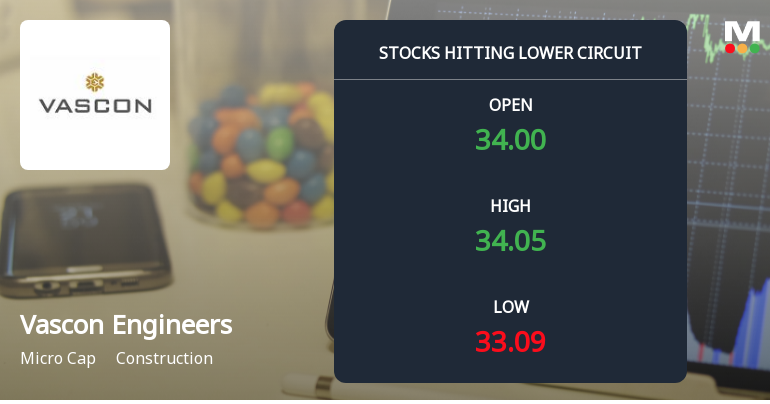
Vascon Engineers Ltd Locks at Lower Circuit With 4.87% Loss — Sellers Queue, No Buyers in Sight
At Rs 33.00, sellers were still queuing — but there were no buyers willing to take the other side. Vascon Engineers Ltd locked at its lower circuit of 4.87% on 12 Jun 2026, with unfilled sell orders and a frozen price.
Read full news article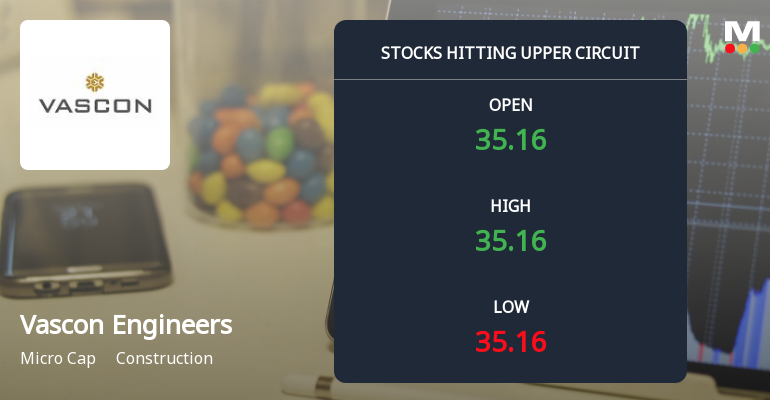
Vascon Engineers Ltd Locks at Upper Circuit With 4.99% Gain — Buyers Queue, Sellers Absent
At Rs 34.73, the buying was done — not because demand dried up, but because the exchange wouldn't let the stock go any higher. Vascon Engineers Ltd locked at its upper circuit of 4.99% on 11 Jun 2026, with buyers queuing and no sellers willing to part with shares.
Read full news article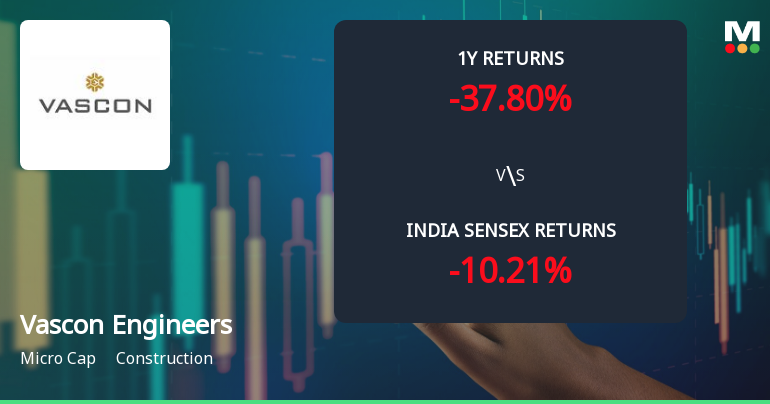
Vascon Engineers Ltd Sees Technical Momentum Shift Amid Mixed Market Signals
Vascon Engineers Ltd has experienced a notable shift in its technical momentum, moving from a strongly bearish stance to a mildly bearish outlook, reflecting a complex interplay of technical indicators. Despite a 4.98% rise in the stock price to ₹33.49 on 11 Jun 2026, the micro-cap construction firm continues to face challenges amid mixed signals from key momentum and trend indicators.
Read full news article Announcements
Announcement under Regulation 30 (LODR)-Award_of_Order_Receipt_of_Order
10-Jun-2026 | Source : BSEThe receipt of the work order for Demolition and Re-development of RBI Quarters at Zoo - Narengi Road Colony Guwahati Assam amounting to Rs.347.43 Crore
Compliances-Reg.24(A)-Annual Secretarial Compliance
30-May-2026 | Source : BSEAnnual Secretarial Compliance Report for year ended March 31 2026 under Regulation 24A of SEBI (LODR) Regulations 2015
Shareholder Meeting / Postal Ballot-Scrutinizers Report
19-May-2026 | Source : BSEScrutinizer Report cum Voting Results of EOGM held on May 18 2026
Corporate Actions

No Upcoming Board Meetings

Vascon Engineers Ltd has declared 2% dividend, ex-date: 21 Aug 23

No Splits history available

No Bonus history available

Vascon Engineers Ltd has announced 14:19 rights issue, ex-date: 23 Jun 15
Quality key factors
Valuation key factors
Technicals key factors
 Technical Indicator Scale: Bearish, Mildly Bearish, Sideways, Mildly Bullish, Bullish Turned
 Shareholding Snapshot : Mar 2026
Shareholding Compare (%holding)
Non Institution
None
Held by 0 Schemes
Held by 24 FIIs (0.51%)
Vasudevan Ramamoorthy (in The Capacity Of Managing Trustee) (14.17%)
Santosh Sundararajan (5.23%)
50.11%
Quarterly Results Snapshot (Consolidated) - Mar'26 - QoQ

QoQ Growth in quarter ended Mar 2026 is 1.48% vs 10.53% in Dec 2025
QoQ Growth in quarter ended Mar 2026 is -38.36% vs -18.81% in Dec 2025
Half Yearly Results Snapshot (Consolidated) - Sep'25
Growth in half year ended Sep 2025 is 12.82% vs 28.65% in Sep 2024

Growth in half year ended Sep 2025 is 70.27% vs -38.85% in Sep 2024
Nine Monthly Results Snapshot (Consolidated) - Dec'25
YoY Growth in nine months ended Dec 2025 is 0.78% vs 34.30% in Dec 2024
YoY Growth in nine months ended Dec 2025 is -54.78% vs 86.78% in Dec 2024
Annual Results Snapshot (Consolidated) - Mar'26
YoY Growth in year ended Mar 2026 is -11.93% vs 44.12% in Mar 2025
YoY Growth in year ended Mar 2026 is -62.46% vs 91.71% in Mar 2025
About Vascon Engineers Ltd

Company Coordinates


