
Compare Vashu Bhagnani with Similar Stocks
Dashboard
Poor Management Efficiency with a low ROE of 6.21%
- The company has been able to generate a Return on Equity (avg) of 6.21% signifying low profitability per unit of shareholders funds
With ROE of 2.1, it has a Very Expensive valuation with a 3.3 Price to Book Value
Underperformed the market in the last 1 year
Stock DNA
Media & Entertainment
INR 486 Cr (Micro Cap)
154.00
18
0.00%
-0.05
2.14%
3.24
Total Returns (Price + Dividend) 
Vashu Bhagnani for the last several years.
Risk Adjusted Returns v/s
Returns Beta

News

Vashu Bhagnani Industries Ltd is Rated Sell
Vashu Bhagnani Industries Ltd is rated 'Sell' by MarketsMOJO, with this rating last updated on 06 July 2026. However, the analysis and financial metrics presented here reflect the stock's current position as of 18 July 2026, providing investors with an up-to-date view of the company’s fundamentals, returns, and market standing.
Read full news article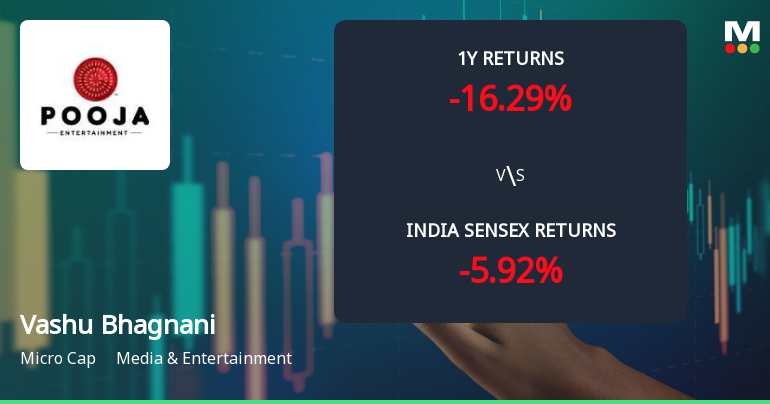
Vashu Bhagnani Industries Ltd Technical Momentum Shifts Amid Mixed Market Signals
Vashu Bhagnani Industries Ltd, a micro-cap player in the Media & Entertainment sector, has experienced a notable shift in its technical momentum, moving from a mildly bearish stance to a sideways trend. Despite a modest day gain of 0.72%, the stock’s technical indicators present a complex picture, with mixed signals from MACD, RSI, Bollinger Bands, and moving averages, prompting a downgrade in its Mojo Grade from Hold to Sell as of 6 July 2026.
Read full news article
Vashu Bhagnani Industries Ltd Downgraded to Sell Amid Technical and Valuation Concerns
Vashu Bhagnani Industries Ltd has seen its investment rating downgraded from Hold to Sell, reflecting a complex interplay of deteriorating technical indicators, valuation concerns, and subdued financial performance despite some positive quarterly results. The company’s micro-cap status and recent sideways technical trend have contributed to a cautious outlook from analysts.
Read full news article Announcements
Compliances-Certificate under Reg. 74 (5) of SEBI (DP) Regulations 2018
14-Jul-2026 | Source : BSECertificate under Regulation 74(5) of SEBI (DP) Regulations 2018 for quarter ended June 30 2026.
Shareholder Meeting / Postal Ballot-Outcome of EGM
01-Jul-2026 | Source : BSEVoting results for the Extra-Ordinary General Meeting held on 30th June 2026.
Shareholder Meeting / Postal Ballot-Scrutinizers Report
01-Jul-2026 | Source : BSEScrutinizers Report for the Extra-Ordinary General Meeting held on 30th June 2026.
Corporate Actions

No Upcoming Board Meetings

No Dividend history available

No Splits history available

Vashu Bhagnani Industries Ltd has announced 6:1 bonus issue, ex-date: 08 Dec 23

No Rights history available
Quality key factors
Valuation key factors
Technicals key factors
 Technical Indicator Scale: Bearish, Mildly Bearish, Sideways, Mildly Bullish, Bullish Turned
 Shareholding Snapshot : Jun 2026
Shareholding Compare (%holding)
Promoters
None
Held by 0 Schemes
Held by 3 FIIs (4.81%)
Vashu Bhagnani (48.25%)
Rejoice Developers Private Limited (5.16%)
5.23%
Quarterly Results Snapshot (Consolidated) - Mar'26 - QoQ

QoQ Growth in quarter ended Mar 2026 is -73.99% vs 401.69% in Dec 2025
QoQ Growth in quarter ended Mar 2026 is -175.08% vs 114.58% in Dec 2025
Half Yearly Results Snapshot (Consolidated) - Sep'25
Growth in half year ended Sep 2025 is -68.94% vs -65.72% in Sep 2024
Growth in half year ended Sep 2025 is -59.49% vs 218.92% in Sep 2024
Nine Monthly Results Snapshot (Consolidated) - Dec'25

YoY Growth in nine months ended Dec 2025 is 5.21% vs -77.23% in Dec 2024
YoY Growth in nine months ended Dec 2025 is 0.74% vs 115.02% in Dec 2024
Annual Results Snapshot (Consolidated) - Mar'26
YoY Growth in year ended Mar 2026 is -9.82% vs -72.46% in Mar 2025
YoY Growth in year ended Mar 2026 is -49.28% vs -22.99% in Mar 2025
About Vashu Bhagnani Industries Ltd

Company Coordinates


