
Compare Vashu Bhagnani with Similar Stocks
Dashboard
Poor Management Efficiency with a low ROE of 6.21%
- The company has been able to generate a Return on Equity (avg) of 6.21% signifying low profitability per unit of shareholders funds
Company has a Debt to Equity ratio (avg) of 0.18 times
Positive results in Mar 26
With ROE of 2.1, it has a Very Expensive valuation with a 3.5 Price to Book Value
Majority shareholders : Promoters
Underperformed the market in the last 1 year
Stock DNA
Media & Entertainment
INR 515 Cr (Micro Cap)
163.00
21
0.00%
-0.05
2.14%
3.48
Total Returns (Price + Dividend) 
Vashu Bhagnani for the last several years.
Risk Adjusted Returns v/s
Returns Beta

News

Vashu Bhagnani Industries Ltd Upgraded to Hold Amid Mixed Financial and Technical Signals
Vashu Bhagnani Industries Ltd has seen its investment rating upgraded from Sell to Hold, reflecting a nuanced improvement across technical indicators, financial performance, valuation metrics, and company quality. The micro-cap media and entertainment firm’s recent quarterly results and evolving market trends have prompted a reassessment of its outlook, signalling cautious optimism among investors.
Read full news article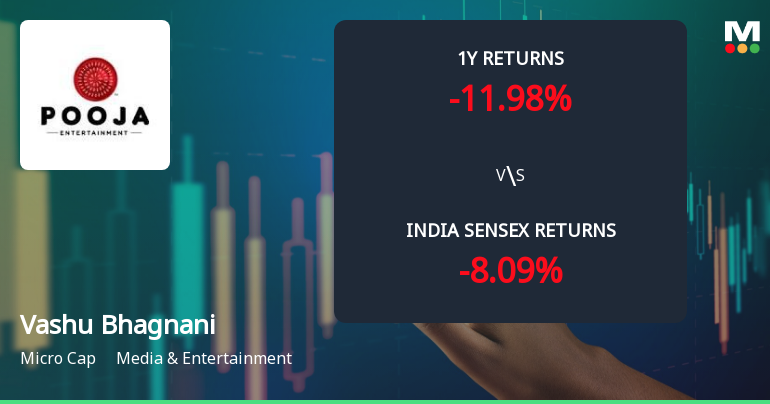
Vashu Bhagnani Industries Ltd Shows Mildly Bullish Momentum Amid Mixed Technical Signals
Vashu Bhagnani Industries Ltd has exhibited a notable shift in price momentum, moving from a sideways trend to a mildly bullish stance, supported by a blend of technical indicators. Despite some bearish signals on longer timeframes, recent price action and moving averages suggest cautious optimism for investors in the media and entertainment sector.
Read full news article
Vashu Bhagnani Industries Ltd is Rated Sell
Vashu Bhagnani Industries Ltd is rated 'Sell' by MarketsMOJO, with this rating last updated on 13 April 2026. However, the analysis and financial metrics presented here reflect the stock’s current position as of 21 June 2026, providing investors with an up-to-date view of the company’s fundamentals, valuation, financial trends, and technical outlook.
Read full news article Announcements
Closure of Trading Window
30-Jun-2026 | Source : BSEClosure of Trading Window for the quarter ended as on 30th June 2026
Shareholder Meeting / Postal Ballot-Outcome of EGM
30-Jun-2026 | Source : BSEOutcome of the Extra-Ordinary General Meeting held on 30th June 2026
Newspaper Advertisement For The 01/2026-27 Extra-Ordinary General Meeting Of The Company
09-Jun-2026 | Source : BSENewspaper advertisement for the 01/2026-24 Extra-Ordinary General Meeting of the Company to be held on Tuesday 30th June 2026 at 03.00 PM through Video Conference (VC)/Other Audio Visual Means (OAVM)
Corporate Actions

No Upcoming Board Meetings

No Dividend history available

No Splits history available

Vashu Bhagnani Industries Ltd has announced 6:1 bonus issue, ex-date: 08 Dec 23

No Rights history available
Quality key factors
Valuation key factors
Technicals key factors
 Technical Indicator Scale: Bearish, Mildly Bearish, Sideways, Mildly Bullish, Bullish Turned
 Shareholding Snapshot : Mar 2026
Shareholding Compare (%holding)
Promoters
None
Held by 0 Schemes
Held by 3 FIIs (4.81%)
Vashu Bhagnani (48.25%)
Rejoice Developers Private Limited (5.16%)
5.45%
Quarterly Results Snapshot (Consolidated) - Mar'26 - QoQ

QoQ Growth in quarter ended Mar 2026 is -73.99% vs 401.69% in Dec 2025
QoQ Growth in quarter ended Mar 2026 is -175.08% vs 114.58% in Dec 2025
Half Yearly Results Snapshot (Consolidated) - Sep'25
Growth in half year ended Sep 2025 is -68.94% vs -65.72% in Sep 2024
Growth in half year ended Sep 2025 is -59.49% vs 218.92% in Sep 2024
Nine Monthly Results Snapshot (Consolidated) - Dec'25

YoY Growth in nine months ended Dec 2025 is 5.21% vs -77.23% in Dec 2024
YoY Growth in nine months ended Dec 2025 is 0.74% vs 115.02% in Dec 2024
Annual Results Snapshot (Consolidated) - Mar'26
YoY Growth in year ended Mar 2026 is -9.82% vs -72.46% in Mar 2025
YoY Growth in year ended Mar 2026 is -49.28% vs -22.99% in Mar 2025
About Vashu Bhagnani Industries Ltd

Company Coordinates


