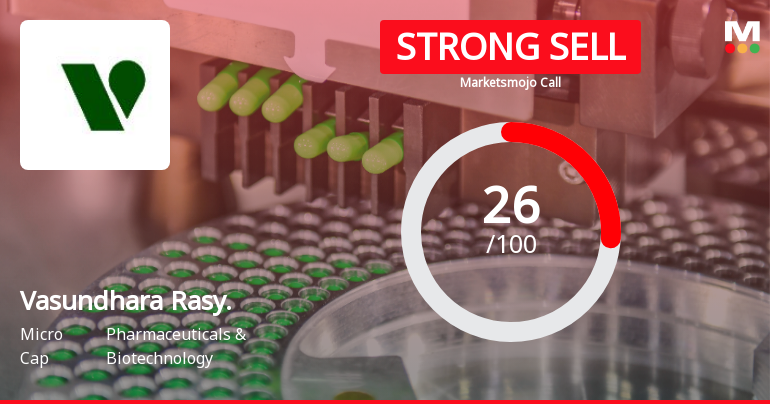
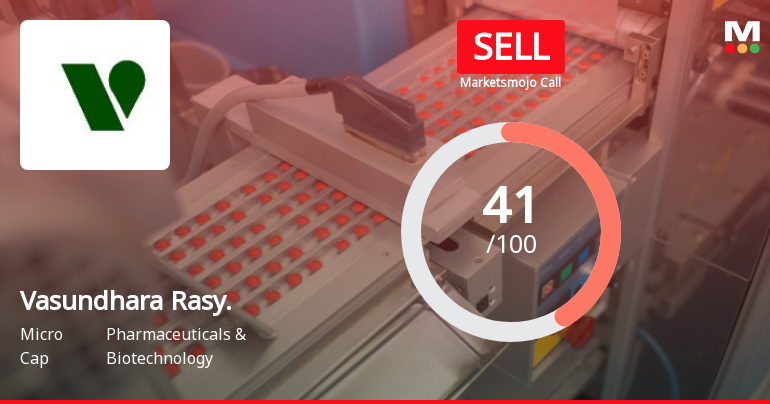
Vasundhara Rasy.

  • Market Cap: Micro Cap
  • Industry: Pharmaceuticals & Biotechnology
  • ISIN: INE406F01010
  • NSEID:
  • BSEID: 538634
INR
156.00
0.00 (0.00%)
BSENSE

Aug 31, 01:17 PM

BSE+NSE Vol: 357

  • Price Points
  • Score
  • Mojo Parameters
  • Total Return
  • News and Corporate Actions
  • Key factors
  • Shareholding
  • Financials
  • CompanyCV
stock-summaryPrice Point
High/Low

1Day

52 Week

Valuation
Technical
Day's Volume

CASH

357 (15.46%) Volume

Shareholding (Jun 2026)

FII

0.00%

Held by 0 FIIs

DII

0.00%

Held by 0 DIIs

Promoter

61.98%

Why is Vasundhara Rasayans Ltd falling/rising?

31-Aug-2026

As of 30-Aug, Vasundhara Rasayans Ltd's stock price is currently rising at 156.00, with a short-term gain of 2.63% over three days. However, it has seen significant declines over the past month and year, and a drop in delivery volume suggests potential concerns for future momentum.

As of 30-Aug, Vasundhara Rasayans Ltd's stock price is rising, currently at 156.00, reflecting a change of 1.05 (0.68%) upward. The stock has been gaining for the last three days, with a total return of 2.63% during this period. Additionally, it has outperformed its sector by 0.75% today. <BR><BR>Despite this recent uptick, the stock has experienced a decline over longer periods, with a 10.60% drop over the past month and an 11.81% decrease over the past year. However, the current performance indicates a positive short-term trend, contrasting with the broader market, as the Sensex has shown a slight decline of 0.36% over the past week. <BR><BR>It is important to note that while the stock is currently rising, there are signs of falling investor participation, as evidenced by a significant drop in delivery volume, which decreased by 74.91% against the 5-day average. This could indicate a potential concern for sustained upward momentum in the future.

View full answer

Should I buy, sell or hold Vasundhara Rasayans Ltd?

26-Aug-2026

Who are in the management team of Vasundhara Rasy.?

14-Aug-2026

The management team of Vasundhara Rasy includes Rajesh Pokerna (Managing Director), Sanjoy Kumar Jain, Sunil Jain Kumar, Seema Jain, and Manish Kumar Jain (all Executive Directors), along with independent directors Pradeep Kumar Jain, Pravichandra Majumdar Popatlal, Rajiv Kakodkar, Manish Jain, and Ashish Kedia. This team oversees the company's governance and strategic direction.

The management team of Vasundhara Rasy includes the following members:<BR><BR>1. **Rajesh Pokerna** - Executive Director & Managing Director<BR>2. **Sanjoy Kumar Jain** - Executive Director & Whole-time Director<BR>3. **Sunil Jain Kumar** - Executive Director & Whole-time Director<BR>4. **Seema Jain** - Executive Director & Whole-time Director<BR>5. **Manish Kumar Jain** - Whole-time Director<BR>6. **Pradeep Kumar Jain** - Independent Non-Executive Director<BR>7. **Pravichandra Majumdar Popatlal** - Independent Non-Executive Director<BR>8. **Rajiv Kakodkar** - Independent Non-Executive Director<BR>9. **Manish Jain** - Independent Director<BR>10. **Ashish Kedia** - Independent Director<BR><BR>This team comprises both executive and independent directors, contributing to the governance and strategic direction of the company.

View full answer

What does Vasundhara Rasy. do?

14-Aug-2026

Vasundhara Rasayans Ltd is a Micro Cap company specializing in the manufacture and export of Antacids therapeutic Active Pharmaceutical Ingredients. As of March 2026, it reported net sales of 12 Cr and a net profit of 2 Cr.

Overview: <BR>Vasundhara Rasayans Ltd is a leading manufacturer and exporter of Antacids therapeutic category of Active Pharmaceutical Ingredients, operating within the Pharmaceuticals & Biotechnology industry and classified as a Micro Cap company.<BR><BR>History: <BR>The company was incorporated in March 1987 and commenced operations in 1990 with an Antacid API facility. The latest reported financial results are for the quarter ending March 2026.<BR><BR>Financial Snapshot: <BR>Net Sales: 12 Cr (Quarterly Results - Mar 2026) <BR>Net Profit: 2 Cr (Quarterly Results - Mar 2026) <BR>Market-cap: INR 58 Cr (Micro Cap)<BR><BR>Key Metrics: <BR>P/E: 10.00 <BR>Industry P/E: 44 <BR>Dividend Yield: 1.11% <BR>Debt Equity: -0.08 <BR>Return on Equity: 14.26% <BR>Price to Book: 1.40 <BR><BR>Contact Details: <BR>Address: Shed No 42 Phase II IDA, Mallapur Hyderabad Telangana : 500076 <BR>Tel: 91-40-23437617/23437623 <BR>Email: info@vrlindia.in <BR>Website: http://www.vasundhararasayans.in

View full answer

Who are the peers of the Vasundhara Rasy.?

14-Aug-2026

Vasundhara Rasy.'s peers include Asston Pharmaceu, Kabra Drugs, Phaarmasia, Biofil Chemicals, Vivo Bio Tech, Shelter Pharma, Mangalam Drugs, Vilin Bio Med, Ajooni Biotech, and JFL Life. Its 1-year return is -3.32%, better than Mangalam Drugs (-63.83%) but worse than Phaarmasia (215.60%).

Peers: The peers of Vasundhara Rasy. are Asston Pharmaceu, Kabra Drugs, Phaarmasia, Biofil Chemicals, Vivo Bio Tech, Shelter Pharma, Mangalam Drugs, Vilin Bio Med, Ajooni Biotech, and JFL Life.<BR><BR>Quality Snapshot: Excellent management risk is observed at Kabra Drugs and Shelter Pharma, while Average management risk is found at Asston Pharmaceu, Vasundhara Rasy., Biofil Chemicals, and the rest. Growth is Excellent at Kabra Drugs, Good at Shelter Pharma, Average at Phaarmasia, Ajooni Biotech, and the rest, while Below Average growth is seen at Asston Pharmaceu, Vasundhara Rasy., Biofil Chemicals, Vivo Bio Tech, Mangalam Drugs, and the rest. Capital Structure is Good at Vasundhara Rasy. and Ajooni Biotech, Excellent at Shelter Pharma, and Average at Asston Pharmaceu, Biofil Chemicals, and the rest, while Below Average is noted at Kabra Drugs, Phaarmasia, Vivo Bio Tech, Mangalam Drugs, Vilin Bio Med.<BR><BR>Return Snapshot: The peer with the highest 1-year return is Phaarmasia at 215.60%, while the lowest is Mangalam Drugs at -63.83%. Vasundhara Rasy.'s own 1-year return is -3.32%, which is higher than Mangalam Drugs but lower than Phaarmasia. Additionally, the six-month return is negative for Kabra Drugs, Phaarmasia, Biofil Chemicals, Vivo Bio Tech, Shelter Pharma, Mangalam Drugs.

View full answer

How big is Vasundhara Rasy.?

14-Aug-2026

As of 14th August, Vasundhara Rasayans Ltd has a market capitalization of 58.00 Cr, with net sales of 35.72 Cr and a net profit of 5.83 Cr over the latest four quarters. The company has shareholder's funds of 40.88 Cr and total assets of 47.88 Cr as of March 2026.

As of 14th August, Vasundhara Rasayans Ltd has a market capitalization of 58.00 Cr, categorizing it as a Micro Cap company.<BR><BR>In the latest four quarters, the company reported net sales of 35.72 Cr and a net profit of 5.83 Cr.<BR><BR>For the reporting period of March 2026, the company has shareholder's funds amounting to 40.88 Cr and total assets of 47.88 Cr.

View full answer

When is the next results date for Vasundhara Rasayans Ltd?

07-Aug-2026

The next results date for Vasundhara Rasayans Ltd is 14 August 2026.

The next results date for Vasundhara Rasayans Ltd is scheduled for 14 August 2026.

View full answer

Are Vasundhara Rasayans Ltd latest results good or bad?

11-Feb-2026

Vasundhara Rasayans Ltd's latest results show strong profit growth with a 261.40% increase in net profit to ₹2.06 crores and an improved operating margin of 24.04%. However, revenue declined by 9.82% year-on-year to ₹8.82 crores, indicating challenges despite the positive profit performance.

The latest results for Vasundhara Rasayans Ltd present a mixed picture. On one hand, the company reported a significant increase in net profit for Q2 FY26, reaching ₹2.06 crores, which is a remarkable 261.40% increase quarter-on-quarter. This improvement is accompanied by a strong operating margin of 24.04%, a substantial rise from just 4.23% in the previous quarter. <BR><BR>However, the revenue figures tell a different story. The company generated ₹8.82 crores in revenue for Q2 FY26, which represents a 9.82% decline compared to the same quarter last year. While there was a sequential growth of 16.67% from the previous quarter, the year-on-year drop raises concerns about the sustainability of this growth.<BR><BR>Overall, while the profit margins and operational efficiency have improved significantly, the decline in revenue indicates underlying challenges that the company faces. This combination of strong profit growth alongside stagnating revenue suggests that while there are positive aspects, there are also serious concerns that need to be addressed. Therefore, the results can be seen as good in terms of profitability but bad in terms of revenue growth, reflecting a complex situation for the company.

View full answer

Is Vasundhara Rasy. overvalued or undervalued?

05-Dec-2025

As of December 4, 2025, Vasundhara Rasy. is considered overvalued with a valuation grade of "expensive," a PE Ratio of 13.42, and a year-to-date return of -35.36%, significantly lagging behind its peers and the Sensex.

As of 4 December 2025, the valuation grade for Vasundhara Rasy. has moved from very expensive to expensive, indicating a shift in perception regarding its market valuation. The company is currently considered overvalued. Key ratios include a PE Ratio of 13.42, an EV to EBITDA of 14.79, and a ROE of 12.74%. <BR><BR>In comparison to peers, Vasundhara Rasy.'s PE Ratio is significantly lower than Solar Industries, which has a PE of 88.66, and Gujarat Fluoroch at 54.14. While Vasundhara Rasy. shows a PEG Ratio of 0.00, indicating no growth expectations, its current valuation does not align favorably with its peers in the Pharmaceuticals & Biotechnology sector. Additionally, the company's recent stock performance has lagged behind the Sensex, with a year-to-date return of -35.36% compared to the Sensex's 9.12%, further reinforcing the overvaluation narrative.

View full answer

How has been the historical performance of Vasundhara Rasy.?

13-Nov-2025

Vasundhara Rasy has experienced fluctuating net sales and profits, peaking at 37.94 Cr in Mar'23 but declining to 33.99 Cr by Mar'25, alongside a decrease in profitability and negative cash flow trends. Despite an increase in total assets and liabilities, the company's operating profit margin and overall profitability have faced significant challenges.

Answer:<BR>The historical performance of Vasundhara Rasy shows a fluctuating trend in net sales and profits over the years, with a notable decline in recent periods.<BR><BR>Breakdown:<BR>Vasundhara Rasy's net sales peaked at 37.94 Cr in Mar'23 but fell to 33.99 Cr by Mar'25. The total operating income followed a similar trend, decreasing from 37.94 Cr in Mar'23 to 33.99 Cr in Mar'25. The raw material costs have remained relatively stable, with a slight increase from 15.53 Cr in Mar'24 to 15.63 Cr in Mar'25. Operating profit (PBDIT) also declined from 8.33 Cr in Mar'24 to 6.40 Cr in Mar'25, reflecting a decrease in operating profit margin from 17.26% to 11.92%. Profit before tax decreased from 7.90 Cr in Mar'24 to 5.77 Cr in Mar'25, while profit after tax dropped from 5.86 Cr to 4.25 Cr in the same period. The company's total assets increased from 37.30 Cr in Mar'24 to 43.07 Cr in Mar'25, alongside a rise in total liabilities from 37.30 Cr to 43.07 Cr. Cash flow from operating activities showed a negative trend, with a cash outflow of 5.00 Cr in Mar'25 compared to an inflow of 6.00 Cr in Mar'24. Overall, while Vasundhara Rasy has seen growth in total assets, its profitability and cash flow have faced challenges in recent years.

View full answer

What is the technical trend for Vasundhara Rasy.?

09-Jun-2025

As of May 23, 2025, Vasundhara Rasy's technical trend has shifted to a moderate bearish stance, supported by bearish signals from key indicators like the MACD, Bollinger Bands, and moving averages, along with significant underperformance compared to the Sensex.

As of 23 May 2025, the technical trend for Vasundhara Rasy has changed from mildly bearish to bearish. The current stance is bearish with a moderate strength. Key indicators driving this assessment include the weekly MACD and Bollinger Bands both indicating bearish conditions, along with daily moving averages also showing bearish signals. The KST is bearish on a weekly basis and mildly bearish monthly, while Dow Theory reflects a mildly bearish stance on the weekly and monthly time frames. The stock has underperformed significantly compared to the Sensex over various periods, particularly year-to-date and over the past year.

View full answer

Who are the top shareholders of the Vasundhara Rasy.?

06-Jun-2025

The top shareholder of Vasundhara Rasy is P & J Cretechem Private Limited, holding 61.98%, followed by Garg Leasing And Finance Private Limited at 3.55%, while individual investors own 30.05%. There are no mutual funds or foreign institutional investors in the company.

The top shareholders of Vasundhara Rasy include P & J Cretechem Private Limited, which holds the largest stake at 61.98%. The highest public shareholder is Garg Leasing And Finance Private Limited, with a holding of 3.55%. Additionally, individual investors collectively own 30.05% of the company. There are no mutual funds or foreign institutional investors currently holding shares in Vasundhara Rasy.

View full answer

Has Vasundhara Rasy. declared dividend?

06-Jun-2025

Vasundhara Rasayans Ltd has declared a 20% dividend, amounting to ₹2 per share, with an ex-date of September 23, 2024. While the stock has shown strong long-term gains, recent performance reflects negative returns in the short term, and the dividend yield is relatively low at 0.98%.

Vasundhara Rasayans Ltd has declared a 20% dividend.<BR><BR>Dividend Details:<BR>- Percentage announced: 20%<BR>- Amount per share: 2<BR>- Ex-date: 23 Sep 24<BR><BR>Dividend Yield: 0.98%.<BR><BR>Total Returns by Period:<BR>In the last 6 months, the price return was -27.93%, with a dividend return of 0%, resulting in a total return of -27.93%.<BR><BR>Over the past year, the price return was -7.7%, the dividend return was 0.87%, leading to a total return of -6.83%.<BR><BR>In the 2-year period, the price return was 30.53%, the dividend return was 2.57%, culminating in a total return of 33.1%.<BR><BR>During the last 3 years, the price return was 77.1%, with a dividend return of 4.75%, resulting in a total return of 81.85%.<BR><BR>For the 4-year period, the price return was 112.13%, the dividend return was 5.39%, which led to a total return of 117.52%.<BR><BR>In the 5-year span, the price return was 479.66%, with a dividend return of 16.81%, resulting in a total return of 496.47%.<BR><BR>Overall, while Vasundhara Rasayans Ltd has declared a dividend, the recent total returns indicate a mixed performance, with significant gains over longer periods but negative returns in the short term. The dividend yield is relatively low, suggesting that while dividends are being paid, the stock may not be performing strongly in the short run.

View full answer
iScoreScore
Click here to find our call on this stock
Strong Sell
Sell
Hold
Buy
Strong Buy

Dashboard

1

Weak Long Term Fundamental Strength with a 8.52% CAGR growth in Operating Profits over the last 5 years

 
2

Flat results in Jun 26

3

Underperformed the market in the last 1 year

stock-summaryMojo Parameters

Mojo Parameters

Loading Valuation Snapshot...

Stock DNA

stock-summary
Industry

Pharmaceuticals & Biotechnology

stock-summary
Market cap

INR 50 Cr (Micro Cap)

stock-summary
P/E

8.00

stock-summary
Industry P/E

27

stock-summary
Dividend Yield

2.56%

stock-summary
Debt Equity

-0.08

stock-summary
Return on Equity

14.46%

stock-summary
Price to Book

1.21

Revenue and Profits:
Net Sales:
7 Cr
(Quarterly Results - Jun 2026)
Net Profit:
1 Cr
stock-summaryTotal Returns
Total Returns (Price + Dividend) stock-summary
Dividend Yield (2.56%)
TimePeriod
Price Return
Dividend Return
Total Return
3 Months
4.77%
1.24%
6.01%
6 Months
23.52%
1.67%
25.19%
1 Year
-14.57%
2.30%
-12.27%
2 Years
-48.93%
1.93%
-47.0%
3 Years
-25.09%
3.11%
-21.98%
4 Years
31.87%
7.91%
39.78%
5 Years
18.32%
5.60%
23.92%

Latest dividend: 2 per share ex-dividend date: Aug-18-2026

Risk Adjusted Returns v/s stock-summary
Returns Beta
Icon
Beta has not been calculated since enough price history is not available
stock-summaryNews & Corporate Actions

News

Vasundhara Rasayans Falls 15.38%: Downgrade and Valuation Shift Drive Weekly Decline

Announcements stock-summary

Shareholder Meeting / Postal Ballot-Scrutinizer"s Report

27-Aug-2026 | Source : BSE

Scrutinizers Report on the remote e-voting as well as e-voting (Insta-Poll) during the AGM issued by Mrs. Rakhi Agarwal Practising Company secretary Scrutinizer

Shareholder Meeting / Postal Ballot-Outcome of AGM

25-Aug-2026 | Source : BSE

Summary of proceedings of the 39th Annual General Meeting of the Company is attached

Announcement under Regulation 30 (LODR)-Newspaper Publication

16-Aug-2026 | Source : BSE

Newspaper publication of unaudited financial results for the quarter ended on 30.06.2026

Corporate Actions stock-summary

stock-summary
BOARD MEETING

No Upcoming Board Meetings

stock-summary
DIVIDEND

Vasundhara Rasayans Ltd has declared 20% dividend, ex-date: 18 Aug 26

stock-summary
SPLITS

No Splits history available

stock-summary
BONUS

No Bonus history available

stock-summary
RIGHTS

No Rights history available

stock-summaryKey Factors

Quality key factors stock-summary

Factor
Value
Sales Growth (5y)
6.33%
EBIT Growth (5y)
8.52%
EBIT to Interest (avg)
4.28
Debt to EBITDA (avg)
0.49
Net Debt to Equity (avg)
-0.08
Sales to Capital Employed (avg)
1.10
Tax Ratio
25.85%
Dividend Payout Ratio
14.97%
Pledged Shares
0
Institutional Holding
0
ROCE (avg)
17.69%
ROE (avg)
14.74%

Valuation key factors

Factor
Value
P/E Ratio
8
Industry P/E
27
Price to Book Value
1.21
EV to EBIT
8.15
EV to EBITDA
7.54
EV to Capital Employed
1.23
EV to Sales
1.32
PEG Ratio
0.17
Dividend Yield
2.56%
ROCE (Latest)
14.24%
ROE (Latest)
14.46%

Technicals key factors

Indicator
Weekly
Monthly
MACD
Mildly Bearish
Bearish
RSI
Bullish
No Signal
Bollinger Bands
Sideways
Bearish
Moving Averages
Mildly Bullish (Daily)
KST
Bullish
Bearish
Dow Theory
Mildly Bearish
Mildly Bullish
stock-summary Technical Indicator Scale: Bearish, Mildly Bearish, Sideways, Mildly Bullish, Bullish  Turned 
stock-summaryShareholding
Shareholding Snapshot : Jun 2026stock-summary
Shareholding Compare (%holding) stock-summary
Majority shareholders

Promoters

Pledged Promoter Holdings

None

Mutual Funds

Held by 0 Schemes

FIIs

Held by 0 FIIs

Promoter with highest holding

P & J Cretechem Private Limited (61.98%)

Highest Public shareholder

Garg Leasing And Finance Private Limited (3.55%)

Individual Investors Holdings

30.31%

stock-summaryFinancial
[
  {
    "link": "quarterly",
    "btn_text": "All Quarterly Results",
    "header": "Quarterly Results Snapshot (Standalone) - Jun'26 - QoQ",
    "rhs": [
      {
        "prefix": "Net Sales ",
        "suffix": "QoQ Growth in quarter ended Jun 2026 is -41.72% vs 59.60% in Mar 2026",
        "dir": -1
      },
      {
        "prefix": "Standalone Net Profit ",
        "suffix": "QoQ Growth in quarter ended Jun 2026 is -73.79% vs 244.44% in Mar 2026",
        "dir": -1
      }
    ],
    "table": {
      "header": [
        "Jun'26",
        "Mar'26",
        "Change(%)"
      ],
      "body": [
        {
          "field": "Net Sales",
          "val1": "6.93",
          "val2": "11.89",
          "chgp": "-41.72%",
          "chgp_class": "negative"
        },
        {
          "field": "Operating Profit (PBDIT) excl Other Income",
          "val1": "0.68",
          "val2": "2.83",
          "chgp": "-75.97%",
          "chgp_class": "negative"
        },
        {
          "field": "Interest",
          "val1": "0.05",
          "val2": "0.08",
          "chgp": "-37.50%",
          "chgp_class": "positive"
        },
        {
          "field": "Exceptional Items",
          "val1": "0.00",
          "val2": "0.00",
          "chgp": "",
          "chgp_class": "neutral"
        },
        {
          "field": "Standalone Net Profit",
          "val1": "0.65",
          "val2": "2.48",
          "chgp": "-73.79%",
          "chgp_class": "negative"
        },
        {
          "field": "Operating Profit Margin (Excl OI)",
          "val1": "9.81%",
          "val2": "23.80%",
          "chgp": "-13.99%",
          "chgp_class": "negative"
        }
      ]
    }
  },
  {
    "link": "half-yearly",
    "btn_text": "All Half Yearly Results",
    "header": "Half Yearly Results Snapshot (Standalone) - Sep'25",
    "rhs": [
      {
        "prefix": "Net Sales ",
        "suffix": " Growth in half year ended Sep 2025 is -5.92% vs -1.36% in Sep 2024",
        "dir": -1
      },
      {
        "prefix": "Standalone Net Profit ",
        "suffix": " Growth in half year ended Sep 2025 is 12.88% vs -0.43% in Sep 2024",
        "dir": 1
      }
    ],
    "table": {
      "header": [
        "Sep'25",
        "Sep'24",
        "Change(%)"
      ],
      "body": [
        {
          "field": "Net Sales",
          "val1": "16.38",
          "val2": "17.41",
          "chgp": "-5.92%",
          "chgp_class": "negative"
        },
        {
          "field": "Operating Profit (PBDIT) excl Other Income",
          "val1": "2.45",
          "val2": "2.47",
          "chgp": "-0.81%",
          "chgp_class": "negative"
        },
        {
          "field": "Interest",
          "val1": "0.23",
          "val2": "0.13",
          "chgp": "76.92%",
          "chgp_class": "negative"
        },
        {
          "field": "Exceptional Items",
          "val1": "0.00",
          "val2": "0.00",
          "chgp": "",
          "chgp_class": "neutral"
        },
        {
          "field": "Standalone Net Profit",
          "val1": "2.63",
          "val2": "2.33",
          "chgp": "12.88%",
          "chgp_class": "positive"
        },
        {
          "field": "Operating Profit Margin (Excl OI)",
          "val1": "14.96%",
          "val2": "14.19%",
          "chgp": "0.77%",
          "chgp_class": "positive"
        }
      ]
    }
  },
  {
    "link": "nine-monthly",
    "btn_text": "All Nine Monthly Results",
    "header": "Nine Monthly Results Snapshot (Standalone) - Dec'25",
    "rhs": [
      {
        "prefix": "Net Sales ",
        "suffix": "YoY Growth in nine months ended Dec 2025 is -9.15% vs 1.35% in Dec 2024",
        "dir": -1
      },
      {
        "prefix": "Standalone Net Profit ",
        "suffix": "YoY Growth in nine months ended Dec 2025 is -11.38% vs 1.61% in Dec 2024",
        "dir": -1
      }
    ],
    "table": {
      "header": [
        "Dec'25",
        "Dec'24",
        "Change(%)"
      ],
      "body": [
        {
          "field": "Net Sales",
          "val1": "23.83",
          "val2": "26.23",
          "chgp": "-9.15%",
          "chgp_class": "negative"
        },
        {
          "field": "Operating Profit (PBDIT) excl Other Income",
          "val1": "2.97",
          "val2": "4.04",
          "chgp": "-26.49%",
          "chgp_class": "negative"
        },
        {
          "field": "Interest",
          "val1": "0.33",
          "val2": "0.19",
          "chgp": "73.68%",
          "chgp_class": "negative"
        },
        {
          "field": "Exceptional Items",
          "val1": "0.00",
          "val2": "0.00",
          "chgp": "",
          "chgp_class": "neutral"
        },
        {
          "field": "Standalone Net Profit",
          "val1": "3.35",
          "val2": "3.78",
          "chgp": "-11.38%",
          "chgp_class": "negative"
        },
        {
          "field": "Operating Profit Margin (Excl OI)",
          "val1": "12.46%",
          "val2": "15.40%",
          "chgp": "-2.94%",
          "chgp_class": "negative"
        }
      ]
    }
  },
  {
    "link": "annual",
    "btn_text": "All Annual Results",
    "header": "Annual Results Snapshot (Standalone) - Mar'26",
    "rhs": [
      {
        "prefix": "Net Sales ",
        "suffix": "YoY Growth in year ended Mar 2026 is 5.09% vs -8.18% in Mar 2025",
        "dir": 1
      },
      {
        "prefix": "Standalone Net Profit ",
        "suffix": "YoY Growth in year ended Mar 2026 is 36.24% vs -27.47% in Mar 2025",
        "dir": 1
      }
    ],
    "table": {
      "header": [
        "Mar'26",
        "Mar'25",
        "Change(%)"
      ],
      "body": [
        {
          "field": "Net Sales",
          "val1": "35.72",
          "val2": "33.99",
          "chgp": "5.09%",
          "chgp_class": "positive"
        },
        {
          "field": "Operating Profit (PBDIT) excl Other Income",
          "val1": "5.79",
          "val2": "4.05",
          "chgp": "42.96%",
          "chgp_class": "positive"
        },
        {
          "field": "Interest",
          "val1": "0.40",
          "val2": "0.27",
          "chgp": "48.15%",
          "chgp_class": "negative"
        },
        {
          "field": "Exceptional Items",
          "val1": "0.00",
          "val2": "0.00",
          "chgp": "",
          "chgp_class": "neutral"
        },
        {
          "field": "Standalone Net Profit",
          "val1": "5.79",
          "val2": "4.25",
          "chgp": "36.24%",
          "chgp_class": "positive"
        },
        {
          "field": "Operating Profit Margin (Excl OI)",
          "val1": "16.21%",
          "val2": "11.92%",
          "chgp": "4.29%",
          "chgp_class": "positive"
        }
      ]
    }
  }
]

Quarterly Results Snapshot (Standalone) - Jun'26 - QoQstock-summary

Jun'26
Mar'26
Change(%)
Net Sales
6.93
11.89
-41.72%
Operating Profit (PBDIT) excl Other Income
0.68
2.83
-75.97%
Interest
0.05
0.08
-37.50%
Exceptional Items
0.00
0.00
Standalone Net Profit
0.65
2.48
-73.79%
Operating Profit Margin (Excl OI)
9.81%
23.80%
-13.99%
Values in Rs Cr.
Direction Arrows
Net Sales

QoQ Growth in quarter ended Jun 2026 is -41.72% vs 59.60% in Mar 2026

Direction Arrows
Standalone Net Profit

QoQ Growth in quarter ended Jun 2026 is -73.79% vs 244.44% in Mar 2026

Half Yearly Results Snapshot (Standalone) - Sep'25stock-summary

Sep'25
Sep'24
Change(%)
Net Sales
16.38
17.41
-5.92%
Operating Profit (PBDIT) excl Other Income
2.45
2.47
-0.81%
Interest
0.23
0.13
76.92%
Exceptional Items
0.00
0.00
Standalone Net Profit
2.63
2.33
12.88%
Operating Profit Margin (Excl OI)
14.96%
14.19%
0.77%
Values in Rs Cr.
Direction Arrows
Net Sales

Growth in half year ended Sep 2025 is -5.92% vs -1.36% in Sep 2024

Direction Arrows
Standalone Net Profit

Growth in half year ended Sep 2025 is 12.88% vs -0.43% in Sep 2024

Nine Monthly Results Snapshot (Standalone) - Dec'25stock-summary

Dec'25
Dec'24
Change(%)
Net Sales
23.83
26.23
-9.15%
Operating Profit (PBDIT) excl Other Income
2.97
4.04
-26.49%
Interest
0.33
0.19
73.68%
Exceptional Items
0.00
0.00
Standalone Net Profit
3.35
3.78
-11.38%
Operating Profit Margin (Excl OI)
12.46%
15.40%
-2.94%
Values in Rs Cr.
Direction Arrows
Net Sales

YoY Growth in nine months ended Dec 2025 is -9.15% vs 1.35% in Dec 2024

Direction Arrows
Standalone Net Profit

YoY Growth in nine months ended Dec 2025 is -11.38% vs 1.61% in Dec 2024

Annual Results Snapshot (Standalone) - Mar'26stock-summary

Mar'26
Mar'25
Change(%)
Net Sales
35.72
33.99
5.09%
Operating Profit (PBDIT) excl Other Income
5.79
4.05
42.96%
Interest
0.40
0.27
48.15%
Exceptional Items
0.00
0.00
Standalone Net Profit
5.79
4.25
36.24%
Operating Profit Margin (Excl OI)
16.21%
11.92%
4.29%
Values in Rs Cr.
Direction Arrows
Net Sales

YoY Growth in year ended Mar 2026 is 5.09% vs -8.18% in Mar 2025

Direction Arrows
Standalone Net Profit

YoY Growth in year ended Mar 2026 is 36.24% vs -27.47% in Mar 2025

stock-summaryCompany CV
About Vasundhara Rasayans Ltd stock-summary
stock-summary
Vasundhara Rasayans Ltd
Micro Cap
Pharmaceuticals & Biotechnology
Vasundhara Rasayans Limited was incorporated in March, 1987. The Company is the leading manufacturer and exporter of Antacids therapeutic category of Active Pharmaceutical Ingredients with annual capacity of about 1500 MT of powder or its equivalent products. It started its operation in year 1990 with an Antacid API facility offering product in paste, powder and micronised grade of powder.
Company Coordinates stock-summary
Company Details
Shed No 42 Phase II IDA, Mallapur Hyderabad Telangana : 500076
stock-summary
Tel: 91-40-23437617/23437623
stock-summary
info@vrlindia.in
Registrar Details
Cil Securities Ltd , 214 Raghava Ratna Towers , Chirag Ali Lane, Abidas, Hyderabad