
Compare Vasundhara Rasy. with Similar Stocks
Dashboard
Weak Long Term Fundamental Strength with a -6.46% CAGR growth in Operating Profits over the last 5 years
- PBT LESS OI(Q) At Rs 0.30 cr has Fallen at -63.2% (vs previous 4Q average)
- PAT(Q) At Rs 0.72 cr has Fallen at -36.4% (vs previous 4Q average)
- NET SALES(Q) Lowest at Rs 7.45 cr
Below par performance in long term as well as near term
Stock DNA
Pharmaceuticals & Biotechnology
INR 38 Cr (Micro Cap)
10.00
42
1.64%
-0.04
10.69%
1.09
Total Returns (Price + Dividend) 
Latest dividend: 2 per share ex-dividend date: Sep-19-2025
Risk Adjusted Returns v/s
Returns Beta

News
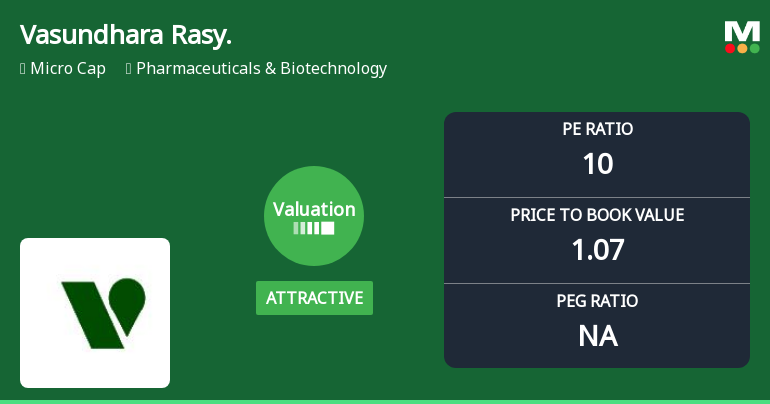
Vasundhara Rasayans Ltd Valuation Shifts Signal Renewed Price Attractiveness Amid Market Challenges
Vasundhara Rasayans Ltd has witnessed a notable shift in its valuation parameters, moving from a fair to an attractive rating, despite ongoing sector headwinds and a challenging price performance relative to the Sensex. This repositioning is underpinned by a significant contraction in its price-to-earnings (P/E) and price-to-book value (P/BV) ratios, suggesting a potential entry point for value-focused investors within the Pharmaceuticals & Biotechnology sector.
Read full news article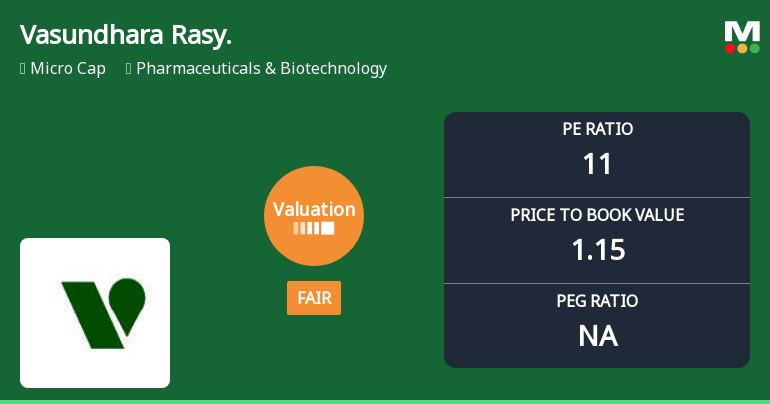
Vasundhara Rasayans Ltd Valuation Shifts Signal Changing Market Sentiment
Vasundhara Rasayans Ltd, a micro-cap player in the Pharmaceuticals & Biotechnology sector, has seen its valuation parameters shift from attractive to fair, reflecting a nuanced change in investor sentiment. Despite a modest day gain of 0.27%, the company’s price-to-earnings (P/E) and price-to-book value (P/BV) ratios now align more closely with sector averages, signalling a recalibration of its price attractiveness amid challenging market returns.
Read full news article
Vasundhara Rasayans Ltd is Rated Strong Sell
Vasundhara Rasayans Ltd is rated Strong Sell by MarketsMOJO, with this rating last updated on 17 Dec 2025. However, the analysis and financial metrics discussed here reflect the stock’s current position as of 08 May 2026, providing investors with the latest insights into the company’s performance and outlook.
Read full news article Announcements
Compliances-Certificate under Reg. 74 (5) of SEBI (DP) Regulations 2018
20-Apr-2026 | Source : BSECertificate as per Reg 74(5) of the SEBI (DP) Reg 2018 for the quarter ended on 31.03.2026
Closure of Trading Window
30-Mar-2026 | Source : BSETrading window for dealing in Shares of Vasundhara Rasayans Limited shall remain closed from 1st April 2026 till 48 hours after the declaration of financial Results for the qaurter and Financial year ended 31.03.2026
Intimation Regarding Extension Of Lease Termination Date
30-Mar-2026 | Source : BSECommunication from the lessor extending the effective date of termination of the manufacturing facility from 31.03.2026 to 30.04.2026
Corporate Actions

No Upcoming Board Meetings

Vasundhara Rasayans Ltd has declared 20% dividend, ex-date: 19 Sep 25

No Splits history available

No Bonus history available

No Rights history available
Quality key factors
Valuation key factors
Technicals key factors
 Technical Indicator Scale: Bearish, Mildly Bearish, Sideways, Mildly Bullish, Bullish Turned
 Shareholding Snapshot : Mar 2026
Shareholding Compare (%holding)
Promoters
None
Held by 0 Schemes
Held by 0 FIIs
P & J Cretechem Private Limited (61.98%)
Garg Leasing And Finance Private Limited (3.55%)
30.2%
Quarterly Results Snapshot (Standalone) - Dec'25 - QoQ

QoQ Growth in quarter ended Dec 2025 is -15.53% vs 16.67% in Sep 2025
QoQ Growth in quarter ended Dec 2025 is -65.05% vs 261.40% in Sep 2025
Half Yearly Results Snapshot (Standalone) - Sep'25
Growth in half year ended Sep 2025 is -5.92% vs -1.36% in Sep 2024

Growth in half year ended Sep 2025 is 12.88% vs -0.43% in Sep 2024
Nine Monthly Results Snapshot (Standalone) - Dec'25
YoY Growth in nine months ended Dec 2025 is -9.15% vs 1.35% in Dec 2024
YoY Growth in nine months ended Dec 2025 is -11.38% vs 1.61% in Dec 2024
Annual Results Snapshot (Standalone) - Mar'25
YoY Growth in year ended Mar 2025 is -8.18% vs -2.42% in Mar 2024
YoY Growth in year ended Mar 2025 is -27.47% vs 4.83% in Mar 2024
About Vasundhara Rasayans Ltd

Company Coordinates


