
Compare Vedanta with Similar Stocks
Dashboard
High Management Efficiency with a high ROCE of 32.52%
Strong ability to service debt as the company has a low Debt to EBITDA ratio of 0.95 times
With ROCE of 37.5, it has a Very Attractive valuation with a 2 Enterprise value to Capital Employed
Company is among the highest 1% of companies rated by MarketsMojo across all 4,000 stocks
Market Beating performance in long term as well as near term
With its market cap of Rs 1,10,234 cr, it is the second biggest company in the sector (behind Hindustan Zinc)and constitutes 25.29% of the entire sector
Stock DNA
Non - Ferrous Metals
INR 110,390 Cr (Large Cap)
7.00
14
12.06%
0.20
30.18%
2.22
Total Returns (Price + Dividend) 
Latest dividend: 3.96 per share ex-dividend date: Mar-27-2026
Risk Adjusted Returns v/s
Returns Beta

News
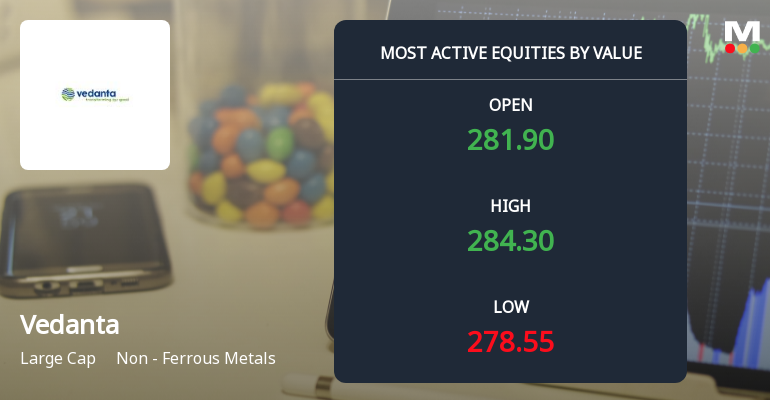
Vedanta Ltd. Sees Robust Trading Activity Amid Institutional Interest and Positive Momentum
Vedanta Ltd., a leading player in the Non-Ferrous Metals sector, has emerged as one of the most actively traded stocks by value on 24 June 2026, reflecting heightened institutional interest and strong market participation. Despite a marginal dip in its share price, the stock continues to outperform its sector and maintain a compelling dividend yield, underscoring its appeal among investors seeking both growth and income.
Read full news article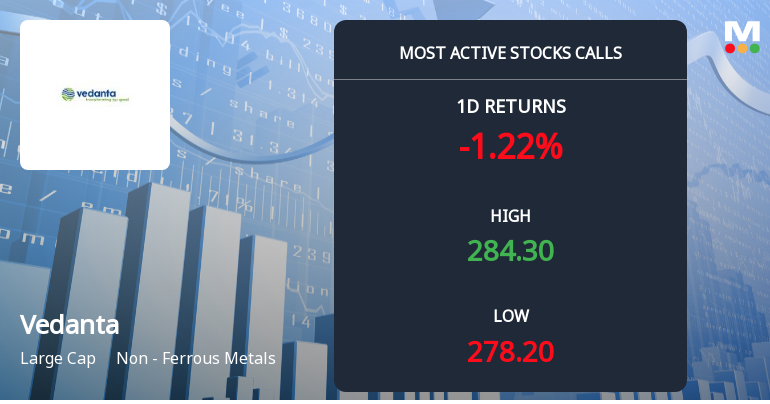
5,152 Call Contracts Traded on Vedanta Ltd. as Stock Holds Near Rs 290 Strike
On 24 Jun 2026, 5,152 call contracts on Vedanta Ltd. changed hands at the Rs 290 strike price, with the stock closing at Rs 281.70. This near-the-money activity coincides with the stock trading above its 100-day and 200-day moving averages, signalling a nuanced directional stance in both the options and cash markets.
Read full news article
Rs 280 Puts — Just Below Current Price — Draw 3,049 Contracts on Vedanta Ltd.
Rs 280 put options on Vedanta Ltd. attracted 3,049 contracts on 24 Jun 2026, with the stock trading marginally above at Rs 281.35. This close proximity of the strike to the underlying price suggests a nuanced interpretation of the put activity beyond simple bearishness.
Read full news article Announcements
Announcement under Regulation 30 (LODR)-Newspaper Publication
21-Jun-2026 | Source : BSEPlease refer the enclosed file.
Announcement under Regulation 30 (LODR)-Newspaper Publication
20-Jun-2026 | Source : BSEPlease refer the enclosed file.
Announcement under Regulation 30 (LODR)-Analyst / Investor Meet - Intimation
20-Jun-2026 | Source : BSEPlease refer the enclosed file.
Corporate Actions

No Upcoming Board Meetings

Vedanta Ltd. has declared 1100% dividend, ex-date: 27 Mar 26

Vedanta Ltd. has announced 1:10 stock split, ex-date: 08 Aug 08

Vedanta Ltd. has announced 1:1 bonus issue, ex-date: 08 Aug 08

No Rights history available
Quality key factors
Valuation key factors
Technicals key factors
 Technical Indicator Scale: Bearish, Mildly Bearish, Sideways, Mildly Bullish, Bullish Turned
 Shareholding Snapshot : Mar 2026
Shareholding Compare (%holding)
Promoters
99.9935
Held by 44 Schemes (6.9%)
Held by 861 FIIs (13.93%)
Twin Star Holdings Ltd (40.02%)
Life Insurance Corporation Of India (4.73%)
11.62%
Quarterly Results Snapshot (Consolidated) - Mar'26 - QoQ

QoQ Growth in quarter ended Mar 2026 is 5.31% vs 24.65% in Dec 2025
QoQ Growth in quarter ended Mar 2026 is 17.30% vs 217.58% in Dec 2025
Half Yearly Results Snapshot (Consolidated) - Sep'25

Growth in half year ended Sep 2025 is 5.85% vs 0.99% in Sep 2024
Growth in half year ended Sep 2025 is -37.38% vs 828.59% in Sep 2024
Nine Monthly Results Snapshot (Consolidated) - Dec'25
YoY Growth in nine months ended Dec 2025 is 11.72% vs -16.41% in Dec 2024
YoY Growth in nine months ended Dec 2025 is -7.06% vs 300.87% in Dec 2024
Annual Results Snapshot (Consolidated) - Mar'26
YoY Growth in year ended Mar 2026 is 14.08% vs -52.16% in Mar 2025
YoY Growth in year ended Mar 2026 is 16.03% vs 253.57% in Mar 2025
About Vedanta Ltd.

Company Coordinates


