
Compare Veer Energy with Similar Stocks
Dashboard
With a Operating Losses, the company has a Weak Long Term Fundamental Strength
- Company's ability to service its debt is weak with a poor EBIT to Interest (avg) ratio of -2.23
- The company has reported losses. Due to this company has reported negative ROCE
Flat results in Mar 26
Risky - Negative EBITDA
Underperformed the market in the last 1 year
Total Returns (Price + Dividend) 
Latest dividend: 0.4559999999999999 per share ex-dividend date: Sep-22-2016
Risk Adjusted Returns v/s
Returns Beta

News
When is the next results date for Veer Energy & Infrastructure Ltd?
The next results date for Veer Energy & Infrastructure Ltd is scheduled for 30 May 2026....
Read full news article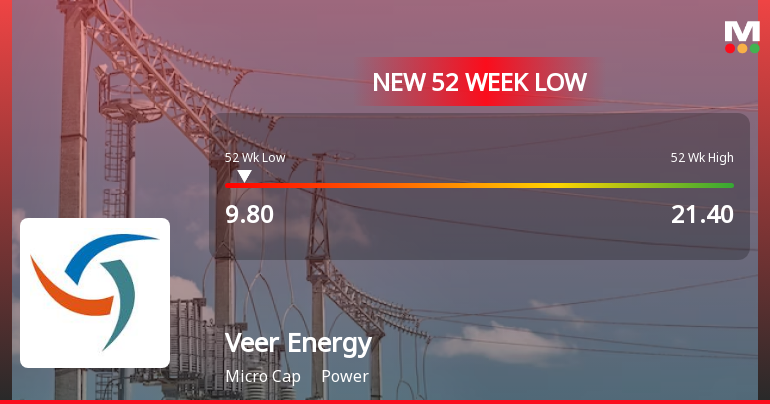
Veer Energy & Infrastructure Ltd Falls to 52-Week Low of Rs 9.1 as Sell-Off Deepens
After a sharp decline over the past year, Veer Energy & Infrastructure Ltd hit a fresh 52-week low of Rs 9.1 on 1 Apr 2026, marking a 57.5% drop from its 52-week high of Rs 21.4. This latest trough comes amid persistent losses and valuation challenges, despite a modest rebound in today’s session.
Read full news article Announcements
Closure of Trading Window
24-Jun-2026 | Source : BSEThis is to inform that trading window will be closed till 48 hours from the declaration of unaudited financial results
Announcement under Regulation 30 (LODR)-Newspaper Publication
01-Jun-2026 | Source : BSEPlease find attached herewith the newspaper advertisment pertaining to audited financial results for March 2026.
Results For The Financial Year Ended March 2026
30-May-2026 | Source : BSEResults for the Financial Year March 2026
Corporate Actions

No Upcoming Board Meetings

Veer Energy & Infrastructure Ltd has declared 6% dividend, ex-date: 22 Sep 16

Veer Energy & Infrastructure Ltd has announced 10:1 stock split, ex-date: 22 Mar 16

Veer Energy & Infrastructure Ltd has announced 3:10 bonus issue, ex-date: 25 Nov 22

No Rights history available
Quality key factors
Valuation key factors
Technicals key factors
 Technical Indicator Scale: Bearish, Mildly Bearish, Sideways, Mildly Bullish, Bullish Turned
 Shareholding Snapshot : Mar 2026
Shareholding Compare (%holding)
Non Institution
None
Held by 0 Schemes
Held by 0 FIIs
Yogesh Mahasuklal Shah (22.8%)
A V Lakshmi (4.53%)
68.51%
Quarterly Results Snapshot (Standalone) - Mar'26 - YoY

YoY Growth in quarter ended Mar 2026 is -66.53% vs -24.16% in Mar 2025

YoY Growth in quarter ended Mar 2026 is -8.77% vs -385.00% in Mar 2025
Half Yearly Results Snapshot (Standalone) - Sep'25
Growth in half year ended Sep 2025 is -41.61% vs 262.91% in Sep 2024
Growth in half year ended Sep 2025 is -32.35% vs 1,033.33% in Sep 2024
Nine Monthly Results Snapshot (Standalone) - Dec'25
YoY Growth in nine months ended Dec 2025 is -52.55% vs 71.93% in Dec 2024
YoY Growth in nine months ended Dec 2025 is 9.33% vs 525.00% in Dec 2024
Annual Results Snapshot (Standalone) - Mar'26
YoY Growth in year ended Mar 2026 is -55.91% vs 19.72% in Mar 2025
YoY Growth in year ended Mar 2026 is 11.11% vs -45.45% in Mar 2025
About Veer Energy & Infrastructure Ltd

Company Coordinates


