
Compare Veeva Systems, Inc. with Similar Stocks
Dashboard
High Management Efficiency with a high ROE of 13.45%
Company has a low Debt to Equity ratio (avg) at times
Healthy long term growth as Net Sales has grown by an annual rate of 18.26% and Operating profit at 21.09%
The company has declared Positive results for the last 8 consecutive quarters
With ROE of 12.57%, it has a fair valuation with a 7.51 Price to Book Value
High Institutional Holdings at 88.81%
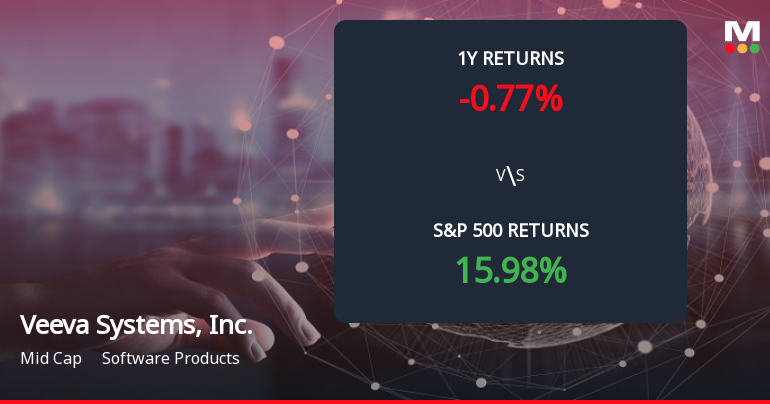
Total Returns (Price + Dividend) 
Veeva Systems, Inc. for the last several years.
Risk Adjusted Returns v/s
News
Veeva Systems Forms Death Cross, Signaling Potential Bearish Trend Ahead
Veeva Systems, Inc. has recently encountered a technical event known as a Death Cross, indicating a potential shift in market sentiment. Current indicators reflect a bearish outlook, with declining moving averages and negative performance metrics, suggesting a challenging environment for the company compared to broader market trends.
Read full news articleIs Veeva Systems, Inc. overvalued or undervalued?
As of 21 November 2025, the valuation grade for Veeva Systems, Inc. moved from expensive to fair. The company appears to be fairly valued based on its current metrics. Key ratios include a P/E ratio of 60, an EV to EBITDA of 49.65, and a PEG ratio of 1.51. In comparison, Fidelity National Information Services, Inc. has a P/E of 59.37, while The Trade Desk, Inc. shows a P/E of 60.98, indicating that Veeva's valuation is in line with its peers. Despite a year-to-date return of 12.12%, which is slightly below the S&P 500's return of 12.26%, Veeva has underperformed over longer periods, with a 3-year return of 25.35% compared to the S&P 500's 67.17%. This suggests that while the stock may be fairly valued now, its recent performance relative to the benchmark raises some concerns about its growth potential....
Read full news article
Veeva Systems Stock Hits Day Low of $237.24 Amid Price Pressure
Veeva Systems, Inc. faced a notable decline in stock value, contrasting with the S&P 500's gains. Despite recent downturns, the company has shown resilience over the past year, with strong net sales growth and consistent operating profit increases, maintaining a solid market position and financial health.
Read full news article Announcements

Corporate Actions
Quality key factors
Valuation key factors
Technicals key factors
 Technical Indicator Scale: Bearish, Mildly Bearish, Sideways, Mildly Bullish, Bullish Turned
 Shareholding Snapshot : Apr 2025
Shareholding Compare (%holding)
Domestic Funds
Held in 151 Schemes (37.21%)
Held by 434 Foreign Institutions (19.98%)
Quarterly Results Snapshot (Consolidated) - Jul'25 - YoY

YoY Growth in quarter ended Jul 2025 is 16.70% vs 14.57% in Jul 2024

YoY Growth in quarter ended Jul 2025 is 17.13% vs 53.23% in Jul 2024
Annual Results Snapshot (Consolidated) - Jan'25
YoY Growth in year ended Jan 2025 is 16.20% vs 9.68% in Jan 2024
YoY Growth in year ended Jan 2025 is 35.84% vs 7.79% in Jan 2024
About Veeva Systems, Inc.

Company Coordinates


