
Compare Venlon Enterpris with Similar Stocks
Dashboard
With a Operating Losses, the company has a Weak Long Term Fundamental Strength
- Poor long term growth as Operating profit has grown by an annual rate 6.10% of over the last 5 years
- Low ability to service debt as the company has a high Debt to EBITDA ratio of -15.86 times
Flat results in Mar 26
Risky - Negative EBITDA
Consistent Underperformance against the benchmark over the last 3 years
Stock DNA
Commodity Chemicals
INR 20 Cr (Micro Cap)
NA (Loss Making)
21
0.00%
3.04
-88.71%
4.98
Total Returns (Price + Dividend) 
Venlon Enterpris for the last several years.
Risk Adjusted Returns v/s
Returns Beta

News

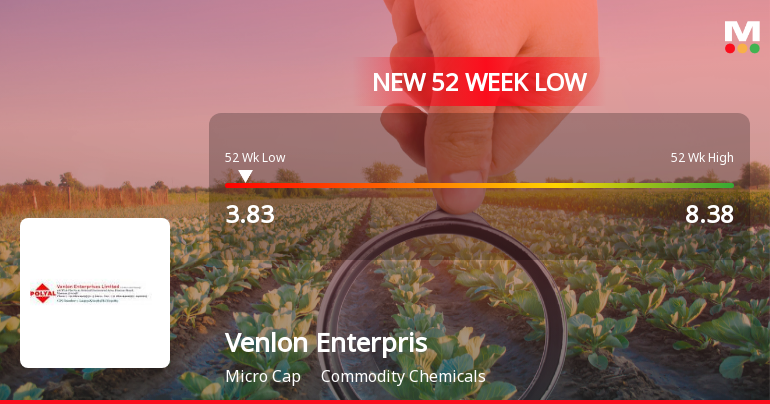
Venlon Enterprises Ltd Falls to 52-Week Low of Rs 3.5 as Sell-Off Deepens
For the third consecutive session, Venlon Enterprises Ltd has closed lower, culminating in a fresh 52-week low of Rs 3.5 on 1 Jul 2026, marking a 17.65% decline over this short span amid broader market gains.
Read full news article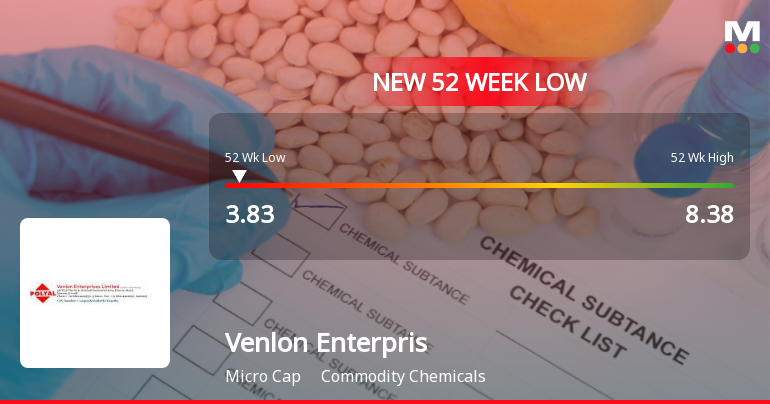
Announcements
Compliances-Certificate under Reg. 74 (5) of SEBI (DP) Regulations 2018
15-Jul-2026 | Source : BSEThe Company based on the certificate from the RTA hereby certifies that the securities received for dematerialisation have been mutilated and cancelled after due verification and the name of the depository has been substituted in our records as the registered owner within 15 days of receipt of certificate of security .
Closure of Trading Window
26-Jun-2026 | Source : BSEWe hereby inform you that the Trading Window for dealing in the securities of the Company will be closed for all the Designated Persons and their immediate relatives with effect from 1st July 2026 till 48 (forty-eight) hours after the financial results of the company for the quarter ending 30th June 2026 becomes generally available information.
Board Meeting Outcome for Outcome Of The Board Meeting Held On 30Th May 2026
30-May-2026 | Source : BSEWe hereby submit the Outcome of the Board Meeting held on 30th May 2026 considered the audited financial results for the quarter and year ended 31st March 2026.
Corporate Actions

No Upcoming Board Meetings

No Dividend history available

No Splits history available

No Bonus history available

No Rights history available
Quality key factors
Valuation key factors
Technicals key factors
 Technical Indicator Scale: Bearish, Mildly Bearish, Sideways, Mildly Bullish, Bullish Turned
 Shareholding Snapshot : Mar 2026
Shareholding Compare (%holding)
Promoters
None
Held by 1 Schemes (0.01%)
Held by 0 FIIs
Dasu Daulatram Datwani (29.13%)
Krishna Enterprises Limited (29.43%)
9.68%
Quarterly Results Snapshot (Standalone) - Mar'26 - QoQ

QoQ Growth in quarter ended Mar 2026 is 91.54% vs -48.82% in Dec 2025

QoQ Growth in quarter ended Mar 2026 is -75.71% vs -52.17% in Dec 2025
Half Yearly Results Snapshot (Standalone) - Sep'25
Growth in half year ended Sep 2025 is -24.27% vs 28.94% in Sep 2024
Growth in half year ended Sep 2025 is -42.16% vs -155.00% in Sep 2024
Nine Monthly Results Snapshot (Standalone) - Dec'25
YoY Growth in nine months ended Dec 2025 is -36.03% vs 46.64% in Dec 2024
YoY Growth in nine months ended Dec 2025 is -47.26% vs -56.99% in Dec 2024
Annual Results Snapshot (Standalone) - Mar'26
YoY Growth in year ended Mar 2026 is -31.08% vs 32.41% in Mar 2025
YoY Growth in year ended Mar 2026 is 74.36% vs -929.69% in Mar 2025
About Venlon Enterprises Ltd

Company Coordinates


