
Compare Venmax Drugs with Similar Stocks
Dashboard
Weak Long Term Fundamental Strength with an average Return on Equity (ROE) of 0.09%
- Poor long term growth as Operating profit has grown by an annual rate 10.45% of over the last 5 years
- Low ability to service debt as the company has a high Debt to EBITDA ratio of -0.05 times
Flat results in Mar 26
With ROE of 4.6, it has a Very Expensive valuation with a 4.8 Price to Book Value
Below par performance in long term as well as near term
Stock DNA
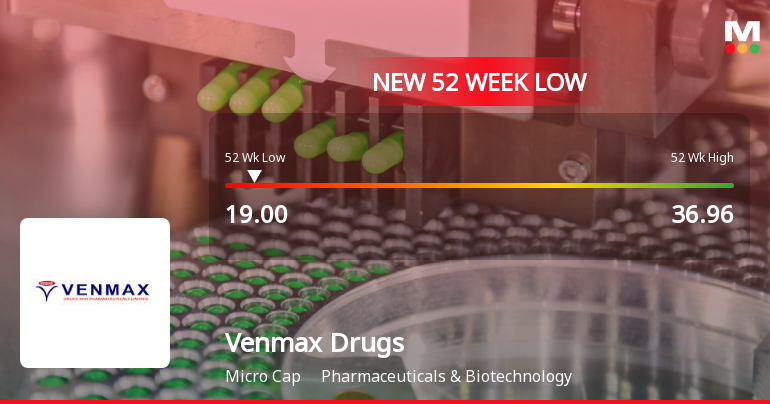
Pharmaceuticals & Biotechnology
INR 23 Cr (Micro Cap)
106.00
35
0.00%
-0.56
4.56%
5.24
Total Returns (Price + Dividend) 
Venmax Drugs for the last several years.
Risk Adjusted Returns v/s
Returns Beta

News

Venmax Drugs & Pharmaceuticals Ltd is Rated Strong Sell
Venmax Drugs & Pharmaceuticals Ltd is rated Strong Sell by MarketsMOJO. This rating was last updated on 16 Feb 2026. However, the analysis and financial metrics presented here reflect the stock’s current position as of 28 May 2026, providing investors with the latest insights into the company’s fundamentals, valuation, financial trends, and technical outlook.
Read full news article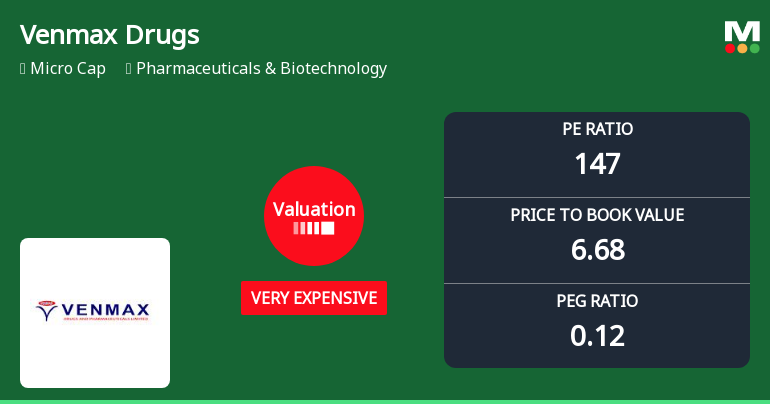
Venmax Drugs & Pharmaceuticals Ltd: Valuation Metrics Signal Heightened Risk Amidst Price Resilience
Venmax Drugs & Pharmaceuticals Ltd has experienced a notable shift in its valuation parameters, with key metrics such as the price-to-earnings (P/E) and price-to-book value (P/BV) ratios moving to levels that challenge its price attractiveness. This article analyses these valuation changes in the context of historical trends, peer comparisons, and the company’s financial performance, highlighting the implications for investors amid a deteriorating quality grade and a micro-cap market capitalisation.
Read full news article Announcements
Closure of Trading Window
27-Jun-2026 | Source : BSEIntimation of Closure of Trading Window pursuant to declaration of unaudited financial results for the quarter ended June 30 2026.
Announcement under Regulation 30 (LODR)-Newspaper Publication
15-May-2026 | Source : BSENewspaper Advertisement of the Audited Financial results for the Quarter and Year ended March 31 2026.
Statement Of Deviation & Variation
15-May-2026 | Source : BSEStatement of Deviation & variation for the Quarter and Year ended March 31 2026.
Corporate Actions

No Upcoming Board Meetings

No Dividend history available

No Splits history available

No Bonus history available

No Rights history available
Quality key factors
Valuation key factors
Technicals key factors
 Technical Indicator Scale: Bearish, Mildly Bearish, Sideways, Mildly Bullish, Bullish Turned
 Shareholding Snapshot : Mar 2026
Shareholding Compare (%holding)
Non Institution
None
Held by 0 Schemes
Held by 0 FIIs
Venkat Narender Nuka (10.55%)
Manish Grover (6.26%)
66.29%
Quarterly Results Snapshot (Standalone) - Mar'26 - QoQ

QoQ Growth in quarter ended Mar 2026 is 154.19% vs 17.42% in Dec 2025
QoQ Growth in quarter ended Mar 2026 is 266.67% vs 50.00% in Dec 2025
Half Yearly Results Snapshot (Standalone) - Sep'25
Not Applicable: The company has declared_date for only one period
Not Applicable: The company has declared_date for only one period
Nine Monthly Results Snapshot (Standalone) - Dec'25
Not Applicable: The company has declared_date for only one period
Not Applicable: The company has declared_date for only one period
Annual Results Snapshot (Standalone) - Mar'26
YoY Growth in year ended Mar 2026 is 890.12% vs 0.00% in Mar 2025
YoY Growth in year ended Mar 2026 is 2,600.00% vs -116.67% in Mar 2025
About Venmax Drugs & Pharmaceuticals Ltd

Company Coordinates


