
Compare Venus Pipes with Similar Stocks
Dashboard
High Management Efficiency with a high ROCE of 31.02%
Strong ability to service debt as the company has a low Debt to EBITDA ratio of 0.98 times
Healthy long term growth as Net Sales has grown by an annual rate of 31.78% and Operating profit at 36.72%
The company has declared Positive results for the last 3 consecutive quarters
High Institutional Holdings at 20.2%
Market Beating performance in long term as well as near term
Stock DNA
Iron & Steel Products
INR 3,545 Cr (Small Cap)
37.00
26
0.05%
0.28
19.25%
7.07
Total Returns (Price + Dividend) 
Latest dividend: 0.4966798418972332 per share ex-dividend date: Nov-18-2025
Risk Adjusted Returns v/s
Returns Beta

News
Venus Pipes & Tubes Ltd is Rated Buy
Venus Pipes & Tubes Ltd is rated 'Buy' by MarketsMOJO, with this rating last updated on 06 July 2026. However, the analysis and financial metrics presented here reflect the stock's current position as of 11 July 2026, providing investors with the most up-to-date insight into the company’s performance and outlook.
Read full news article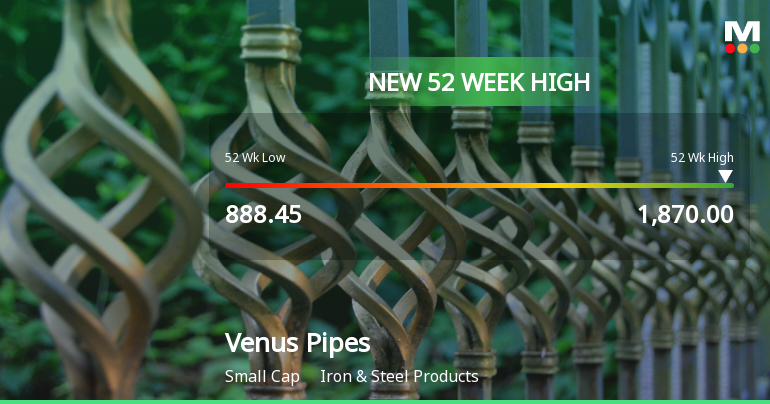
Broad-Based Technical Strength Lifts Venus Pipes & Tubes Ltd to 52-Week High of Rs 1870
With a decisive break above Rs 1870 on 7 Jul 2026, Venus Pipes & Tubes Ltd has reached a fresh 52-week high, extending its impressive 23.40% return over the past year and outpacing the Sensex’s decline of 6.03%. This milestone reflects a sustained rally fuelled by strong technical momentum and a favourable market backdrop.
Read full news article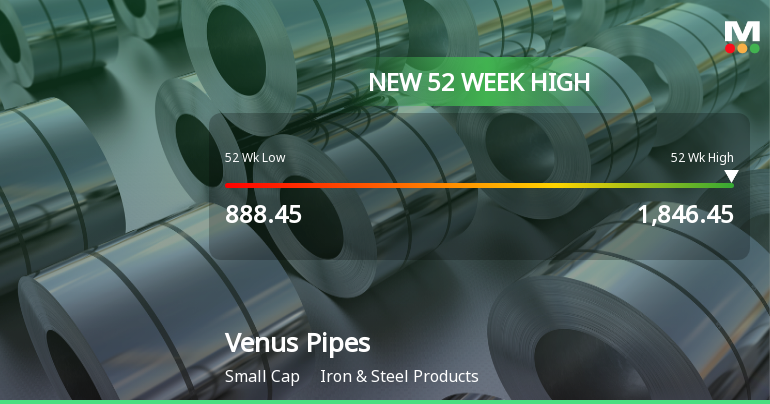
Broad-Based Technical Strength Lifts Venus Pipes & Tubes Ltd to 52-Week High of Rs 1846.45
Surging to a fresh 52-week high of Rs 1846.45 on 6 Jul 2026, Venus Pipes & Tubes Ltd has demonstrated robust price momentum, outperforming its sector and the broader market. This milestone caps a year-long rally that has delivered a 25.54% return, significantly ahead of the Sensex’s 6.32% decline over the same period.
Read full news article Announcements
Corporate Actions

No Upcoming Board Meetings

Venus Pipes & Tubes Ltd has declared 5% dividend, ex-date: 18 Nov 25

No Splits history available

No Bonus history available

No Rights history available
Quality key factors
Valuation key factors
Technicals key factors
 Technical Indicator Scale: Bearish, Mildly Bearish, Sideways, Mildly Bullish, Bullish Turned
 Shareholding Snapshot : Mar 2026
Shareholding Compare (%holding)
Promoters
None
Held by 6 Schemes (6.01%)
Held by 24 FIIs (2.71%)
Megharam S Choudhary (17.35%)
Kotak Mahindra Life Insurance Company Ltd. (4.56%)
24.68%
Quarterly Results Snapshot (Standalone) - Mar'26 - QoQ

QoQ Growth in quarter ended Mar 2026 is 1.85% vs 1.77% in Dec 2025
QoQ Growth in quarter ended Mar 2026 is -0.43% vs -1.84% in Dec 2025
Half Yearly Results Snapshot (Standalone) - Sep'25

Growth in half year ended Sep 2025 is 21.07% vs 26.45% in Sep 2024
Growth in half year ended Sep 2025 is -0.70% vs 35.94% in Sep 2024
Nine Monthly Results Snapshot (Standalone) - Dec'25
YoY Growth in nine months ended Dec 2025 is 23.45% vs 21.15% in Dec 2024
YoY Growth in nine months ended Dec 2025 is 10.52% vs 13.50% in Dec 2024
Annual Results Snapshot (Standalone) - Mar'26
YoY Growth in year ended Mar 2026 is 21.73% vs 19.49% in Mar 2025
YoY Growth in year ended Mar 2026 is 9.76% vs 8.04% in Mar 2025
About Venus Pipes & Tubes Ltd

Company Coordinates


