
Compare Veracyte, Inc. with Similar Stocks
Dashboard
Poor Management Efficiency with a low ROE of 0.76%
- The company has been able to generate a Return on Equity (avg) of 0.76% signifying low profitability per unit of shareholders funds
The company has declared Positive results for the last 11 consecutive quarters
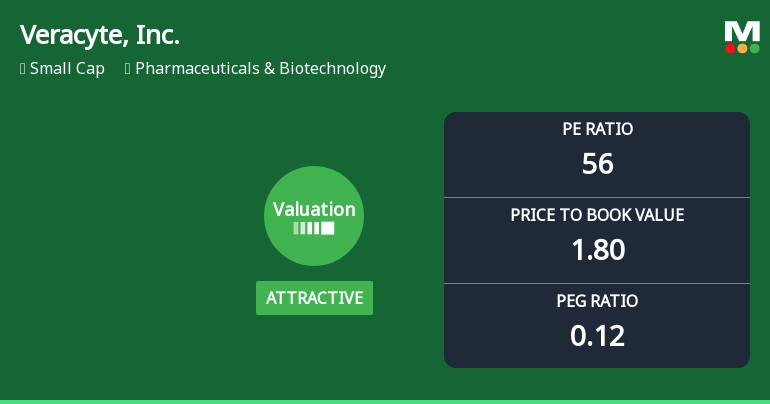
With ROE of 3.21%, it has a fair valuation with a 1.80 Price to Book Value
Underperformed the market in the last 1 year
Stock DNA
Pharmaceuticals & Biotechnology
USD 3,423 Million (Small Cap)
56.00
NA
0.00%
-0.29
4.30%
2.72
Total Returns (Price + Dividend) 
Veracyte, Inc. for the last several years.
Risk Adjusted Returns v/s
News
Veracyte, Inc. Experiences Evaluation Adjustment Amid Competitive Market Landscape
Veracyte, Inc., a small-cap company in the Pharmaceuticals & Biotechnology sector, has adjusted its valuation, currently priced at $36.08. Over the past year, it has returned 6.94%, underperforming the S&P 500. Key metrics include a P/E ratio of 56 and a PEG ratio of 0.12, indicating potential growth.
Read full news article Announcements

Corporate Actions
Quality key factors
Valuation key factors
Technicals key factors
 Technical Indicator Scale: Bearish, Mildly Bearish, Sideways, Mildly Bullish, Bullish Turned
 Shareholding Snapshot : Sep 2025
Shareholding Compare (%holding)
Domestic Funds
Held in 87 Schemes (64.12%)
Held by 150 Foreign Institutions (15.53%)
Quarterly Results Snapshot (Consolidated) - Sep'25 - YoY

YoY Growth in quarter ended Sep 2025 is 13.81% vs 28.63% in Sep 2024
YoY Growth in quarter ended Sep 2025 is 25.66% vs 151.35% in Sep 2024
Annual Results Snapshot (Consolidated) - Dec'24

YoY Growth in year ended Dec 2024 is 23.46% vs 21.79% in Dec 2023
YoY Growth in year ended Dec 2024 is 132.39% vs -103.28% in Dec 2023
About Veracyte, Inc.

Company Coordinates


