
Compare Veranda Learning with Similar Stocks
Dashboard
Weak Long Term Fundamental Strength with an average Return on Capital Employed (ROCE) of 2.07%
- Low ability to service debt as the company has a high Debt to EBITDA ratio of 2.29 times
With a growth in Net Sales of 13.35%, the company declared Outstanding results in Mar 26
With ROCE of 8.3, it has a Attractive valuation with a 1.9 Enterprise value to Capital Employed
30.45% of Promoter Shares are Pledged
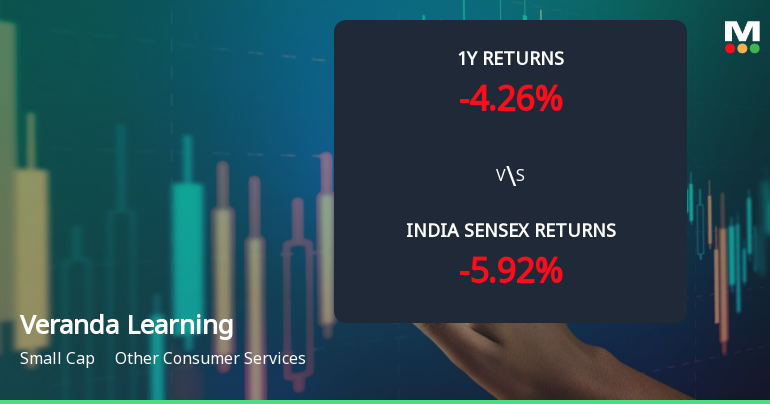
Underperformed the market in the last 1 year
Stock DNA
Other Consumer Services
INR 2,149 Cr (Small Cap)
65.00
179
0.00%
0.37
3.45%
2.26
Total Returns (Price + Dividend) 
Veranda Learning for the last several years.
Risk Adjusted Returns v/s
Returns Beta

News
Veranda Learning Solutions Ltd Technical Momentum Shifts Amid Mixed Market Signals
Veranda Learning Solutions Ltd, a small-cap player in the Other Consumer Services sector, has experienced a notable shift in its technical momentum, moving from a bullish to a mildly bullish stance. Despite a recent day decline of 2.48%, the stock’s broader technical indicators reveal a complex interplay of bullish and bearish signals, suggesting cautious optimism for investors navigating this evolving landscape.
Read full news article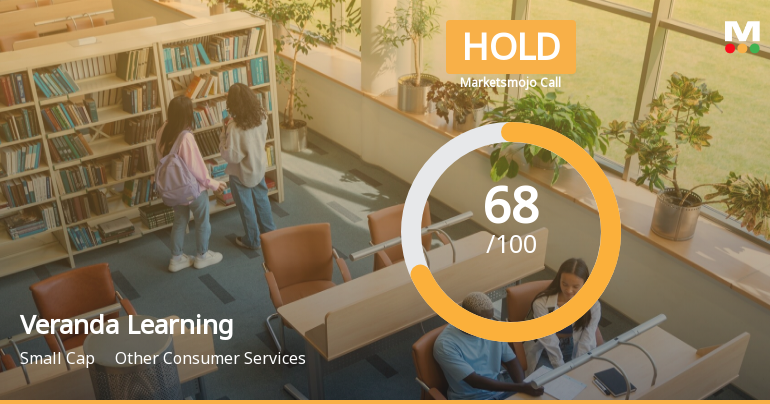
Veranda Learning Solutions Ltd is Rated Hold
Veranda Learning Solutions Ltd is currently rated Hold by MarketsMOJO, with this rating last updated on 16 June 2026. While the rating change occurred on that date, the analysis and financial metrics discussed here reflect the stock’s current position as of 09 July 2026, providing investors with the latest insights into the company’s performance and outlook.
Read full news article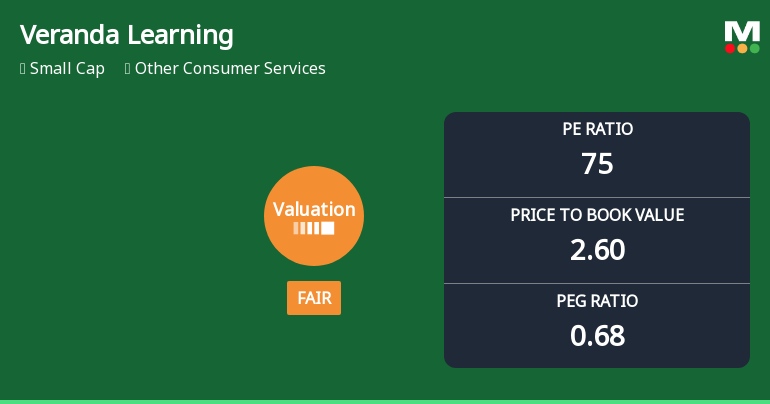
Veranda Learning Solutions Ltd: Valuation Shift Signals Changing Market Sentiment
Veranda Learning Solutions Ltd has witnessed a notable shift in its valuation parameters, moving from an attractive to a fair valuation grade. This change reflects evolving market perceptions amid strong price momentum and improving fundamentals, prompting investors to reassess the stock’s price attractiveness relative to its historical and peer benchmarks.
Read full news article Announcements
Corporate Actions

No Upcoming Board Meetings

No Dividend history available

No Splits history available

No Bonus history available

No Rights history available
Quality key factors
Valuation key factors
Technicals key factors
 Technical Indicator Scale: Bearish, Mildly Bearish, Sideways, Mildly Bullish, Bullish Turned
 Shareholding Snapshot : Mar 2026
Shareholding Compare (%holding)
Non Institution
30.4542
Held by 1 Schemes (0.0%)
Held by 19 FIIs (2.37%)
Kalpathi S Aghoram (10.64%)
Authum Investment And Infrastructure Limited (13.8%)
37.76%
Quarterly Results Snapshot (Consolidated) - Mar'26 - QoQ

QoQ Growth in quarter ended Mar 2026 is 13.35% vs -7.84% in Dec 2025
QoQ Growth in quarter ended Mar 2026 is -14.66% vs -89.18% in Dec 2025
Half Yearly Results Snapshot (Consolidated) - Sep'25
Growth in half year ended Sep 2025 is 20.16% vs 15.63% in Sep 2024
Growth in half year ended Sep 2025 is 259.59% vs -178.26% in Sep 2024
Nine Monthly Results Snapshot (Consolidated) - Dec'25
YoY Growth in nine months ended Dec 2025 is 19.36% vs 12.91% in Dec 2024
YoY Growth in nine months ended Dec 2025 is 141.65% vs -555.01% in Dec 2024
Annual Results Snapshot (Consolidated) - Mar'26
YoY Growth in year ended Mar 2026 is 34.60% vs -1.11% in Mar 2025
YoY Growth in year ended Mar 2026 is 142.66% vs -210.32% in Mar 2025
About Veranda Learning Solutions Ltd

Company Coordinates


