
Compare Vertis Infra. with Similar Stocks
Dashboard
Low ability to service debt as the company has a high Debt to EBITDA ratio of 4.10 times
- Low ability to service debt as the company has a high Debt to EBITDA ratio of 4.10 times
- The company has been able to generate a Return on Equity (avg) of 8.07% signifying low profitability per unit of shareholders funds
With ROCE of 9.8, it has a Very Expensive valuation with a 1.6 Enterprise value to Capital Employed
Below par performance in long term as well as near term
Stock DNA
Construction
INR 16,444 Cr (Small Cap)
23.00
NA
10.10%
1.58
11.08%
2.56
Total Returns (Price + Dividend) 
Latest dividend: 3.0000000000000004 per share ex-dividend date: May-22-2026
Risk Adjusted Returns v/s
Returns Beta

News

Vertis Infrastructure Trust is Rated Sell
Vertis Infrastructure Trust is rated Sell by MarketsMOJO, with this rating last updated on 22 June 2026. However, the analysis and financial metrics discussed below reflect the stock’s current position as of 24 June 2026, providing investors with the most up-to-date view of the company’s fundamentals, returns, and market performance.
Read full news article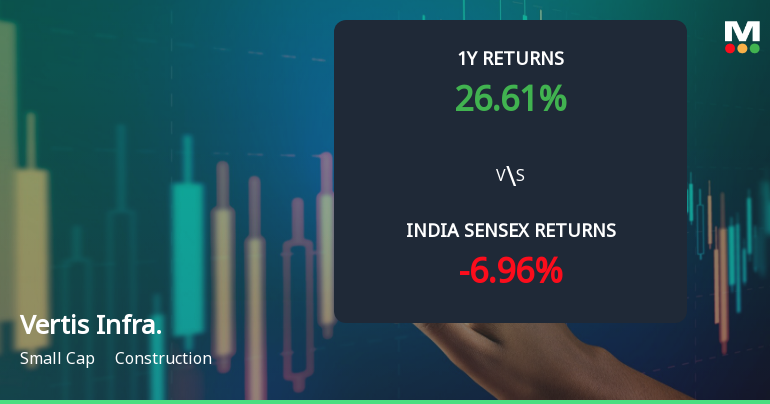
Vertis Infrastructure Trust Shows Mildly Bullish Momentum Amid Mixed Technical Signals
Vertis Infrastructure Trust has experienced a subtle shift in its technical momentum, moving from a sideways trend to a mildly bullish stance. Despite this positive directional change, a detailed analysis of key technical indicators such as MACD, RSI, and moving averages reveals a complex picture that investors should carefully consider before making decisions.
Read full news article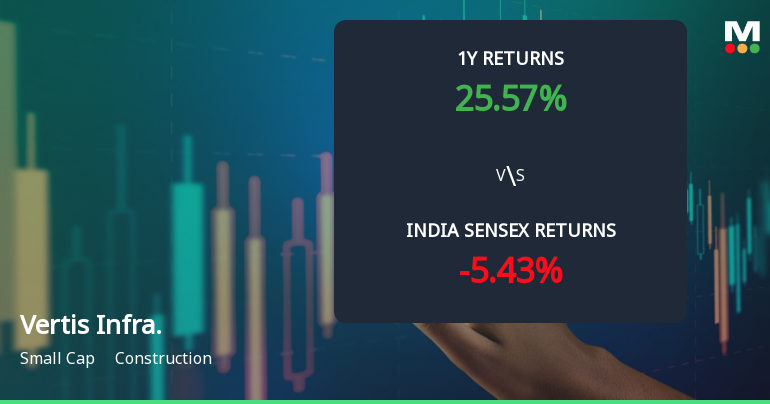
Vertis Infrastructure Trust Technical Momentum Shifts Amid Sideways Trend
Vertis Infrastructure Trust, a small-cap player in the construction sector, has experienced a notable shift in its technical momentum, transitioning from a mildly bullish stance to a sideways trend. Despite a stable price at ₹108.00, technical indicators such as MACD, RSI, and moving averages reveal a nuanced picture of the stock’s near-term outlook, prompting a reassessment of its market positioning and investor sentiment.
Read full news article Announcements
Corporate Actions

No Upcoming Board Meetings

Vertis Infrastructure Trust has declared 3% dividend, ex-date: 22 May 26

No Splits history available

No Bonus history available

No Rights history available
Quality key factors
Valuation key factors
Technicals key factors
 Technical Indicator Scale: Bearish, Mildly Bearish, Sideways, Mildly Bullish, Bullish Turned
 Shareholding Snapshot : Mar 2026
Shareholding Compare (%holding)
Promoters
19.8031
Held by 0 Schemes (1.67%)
Held by 0 FIIs (0.01%)
Nebula Asia Holdings II Pte Ltd (43.81%)
2452991 Ontario Limited (21.75%)
4.34%
Quarterly Results Snapshot (Consolidated) - Mar'26 - QoQ

QoQ Growth in quarter ended Mar 2026 is 3.88% vs 1.44% in Dec 2025
QoQ Growth in quarter ended Mar 2026 is 123.72% vs -51.40% in Dec 2025
Half Yearly Results Snapshot (Consolidated) - Sep'25
Growth in half year ended Sep 2025 is 76.87% vs -6.72% in Sep 2024

Growth in half year ended Sep 2025 is 42.35% vs 172.81% in Sep 2024
Nine Monthly Results Snapshot (Consolidated) - Dec'25
YoY Growth in nine months ended Dec 2025 is 85.27% vs 102.68% in Dec 2024
YoY Growth in nine months ended Dec 2025 is 30.22% vs 109.36% in Dec 2024
Annual Results Snapshot (Consolidated) - Mar'26
YoY Growth in year ended Mar 2026 is 75.85% vs 7.74% in Mar 2025
YoY Growth in year ended Mar 2026 is 34.95% vs 391.46% in Mar 2025
About Vertis Infrastructure Trust

Company Coordinates


