
Compare Veto Switchgears with Similar Stocks
Stock DNA
Electronics & Appliances
INR 251 Cr (Micro Cap)
10.00
24
0.78%
0.07
8.67%
0.85
Total Returns (Price + Dividend) 
Latest dividend: 1.0016806722689076 per share ex-dividend date: Sep-22-2025
Risk Adjusted Returns v/s
Returns Beta

News

Veto Switchgears & Cables Ltd Upgraded to Strong Buy on Robust Technicals and Financials
Veto Switchgears & Cables Ltd has seen its investment rating upgraded from Buy to Strong Buy, driven by significant improvements across technical indicators, valuation metrics, and financial trends. The micro-cap electronics and appliances company’s recent quarterly results and bullish technical signals have combined to enhance investor confidence, marking a pivotal moment for this stock in a challenging market environment.
Read full news article
Veto Switchgears & Cables Ltd Downgraded to Buy Amid Mixed Technical and Financial Signals
Veto Switchgears & Cables Ltd has seen its investment rating downgraded from Strong Buy to Buy following a reassessment of its technical indicators, valuation metrics, financial trends, and overall quality. Despite robust quarterly financials and attractive valuation ratios, the shift in technical signals and mixed long-term performance have prompted a more cautious stance from analysts.
Read full news article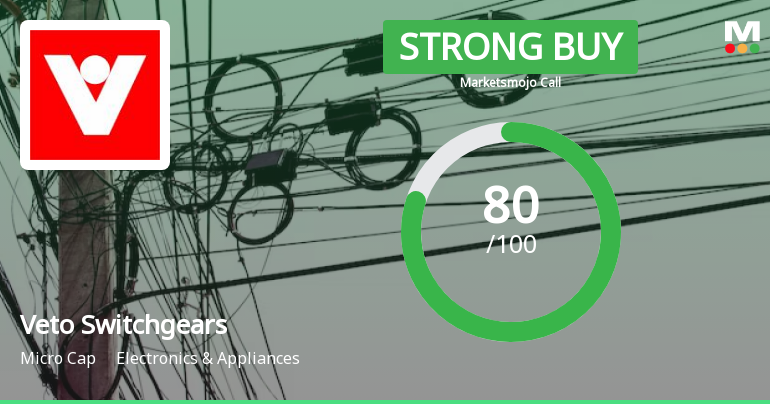
Veto Switchgears & Cables Ltd is Rated Strong Buy
Veto Switchgears & Cables Ltd is rated Strong Buy by MarketsMOJO, with this rating last updated on 23 June 2026. However, the analysis and financial metrics discussed here reflect the company’s current position as of 05 July 2026, providing investors with the most up-to-date insight into the stock’s performance and outlook.
Read full news article Announcements
Veto Switchgears And Cables Limited - Updates
18-Nov-2019 | Source : NSEVeto Switchgears And Cables Limited has informed the Exchange regarding 'Newspaper Advertisement pursuant to Regulation 47 of SEBl (Listing Obligations and Disclosure Requirements) Regulations 2015 ("SEBI Listing Regulations")'.
Veto Switchgears And Cables Limited - Outcome of Board Meeting
14-Nov-2019 | Source : NSEVeto Switchgears And Cables Limited has informed the Exchange regarding Board meeting held on November 13, 2019.
Veto Switchgears And Cables Limited - Updates
16-Oct-2019 | Source : NSEVeto Switchgears And Cables Limited has informed the Exchange regarding 'Certificate under Regulation 74(5) of the SEBI (Depositories and Participants) Regulations, 2018 for the Quarter / Half-Year ended 30th September, 2019'.
Corporate Actions

No Upcoming Board Meetings

Veto Switchgears & Cables Ltd has declared 10% dividend, ex-date: 22 Sep 25

No Splits history available

Veto Switchgears & Cables Ltd has announced 1:10 bonus issue, ex-date: 06 Sep 13

No Rights history available
Quality key factors
Valuation key factors
Technicals key factors
 Technical Indicator Scale: Bearish, Mildly Bearish, Sideways, Mildly Bullish, Bullish Turned
 Shareholding Snapshot : Mar 2026
Shareholding Compare (%holding)
Non Institution
None
Held by 0 Schemes
Held by 1 FIIs (0.01%)
Veto Electropowers (india) Private Limited (32.28%)
Dheeraj Kumar Lohia (1.43%)
48.07%
Quarterly Results Snapshot (Consolidated) - Mar'26 - YoY

YoY Growth in quarter ended Mar 2026 is 55.71% vs 12.26% in Mar 2025

YoY Growth in quarter ended Mar 2026 is 16.45% vs 255.66% in Mar 2025
Half Yearly Results Snapshot (Consolidated) - Sep'25
Growth in half year ended Sep 2025 is 13.40% vs -2.25% in Sep 2024
Growth in half year ended Sep 2025 is -10.05% vs -0.18% in Sep 2024
Nine Monthly Results Snapshot (Consolidated) - Dec'25
YoY Growth in nine months ended Dec 2025 is 17.36% vs -4.29% in Dec 2024
YoY Growth in nine months ended Dec 2025 is 12.06% vs -6.77% in Dec 2024
Annual Results Snapshot (Consolidated) - Mar'26
YoY Growth in year ended Mar 2026 is 28.74% vs 0.10% in Mar 2025
YoY Growth in year ended Mar 2026 is 13.56% vs 23.29% in Mar 2025
About Veto Switchgears & Cables Ltd

Company Coordinates


