
Compare Viceroy Hotels with Similar Stocks
Dashboard
Weak Long Term Fundamental Strength with an average Return on Capital Employed (ROCE) of 2.93%
- Low ability to service debt as the company has a high Debt to EBITDA ratio of 1.52 times
Flat results in Mar 26
With ROCE of 5.7, it has a Very Expensive valuation with a 2.3 Enterprise value to Capital Employed
Despite the size of the company, domestic mutual funds hold only 0% of the company
Stock DNA
Hotels & Resorts
INR 935 Cr (Micro Cap)
30.00
34
0.00%
0.92
11.73%
3.52
Total Returns (Price + Dividend) 
Viceroy Hotels for the last several years.
Risk Adjusted Returns v/s
Returns Beta

News
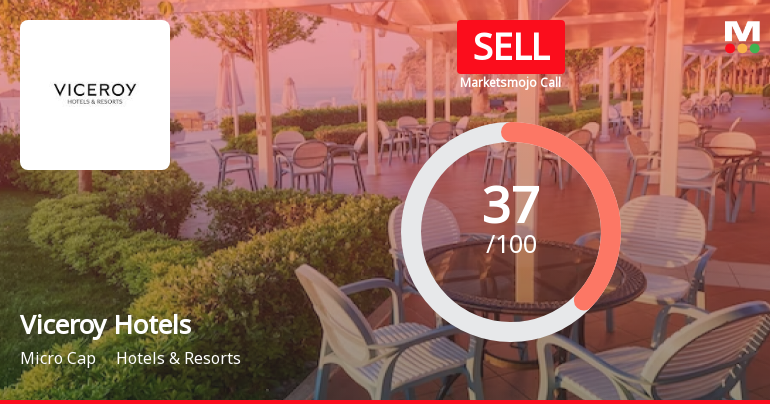
Viceroy Hotels Ltd is Rated Sell
Viceroy Hotels Ltd is rated 'Sell' by MarketsMOJO, with this rating last updated on 29 Sep 2025. However, the analysis and financial metrics discussed here reflect the company’s current position as of 08 June 2026, providing investors with an up-to-date view of the stock’s fundamentals, valuation, financial trends, and technical outlook.
Read full news article
Viceroy Hotels Ltd is Rated Sell
Viceroy Hotels Ltd is rated 'Sell' by MarketsMOJO, with this rating last updated on 29 Sep 2025. However, the analysis and financial metrics discussed here reflect the stock's current position as of 25 May 2026, providing investors with an up-to-date view of the company’s fundamentals, valuation, financial trend, and technical outlook.
Read full news article
Viceroy Hotels Ltd is Rated Sell
Viceroy Hotels Ltd is rated 'Sell' by MarketsMOJO, with this rating last updated on 29 Sep 2025. However, the analysis and financial metrics discussed below reflect the stock's current position as of 14 May 2026, providing investors with an up-to-date perspective on the company’s fundamentals, valuation, financial trends, and technical outlook.
Read full news article Announcements
Viceroy Hotels Limited - Other General Purpose
28-Nov-2019 | Source : NSEViceroy Hotels Limited has informed the Exchange regarding Submission of Half-Yearly Disclosure on Related Party Transactions.
Viceroy Hotels Limited - Outcome of Board Meeting
14-Nov-2019 | Source : NSEViceroy Hotels Limited has informed the Exchange regarding Outcome of Board Meeting held on November 13, 2019.
Viceroy Hotels Limited - Other General Purpose
01-Nov-2019 | Source : NSEViceroy Hotels Limited has informed the Exchange about Outcome of extended 18th Committee of Creditors Meeting (2)
Corporate Actions

No Upcoming Board Meetings

No Dividend history available

No Splits history available

No Bonus history available

Viceroy Hotels Ltd has announced 7:10 rights issue, ex-date: 29 Nov 24
Quality key factors
Valuation key factors
Technicals key factors
 Technical Indicator Scale: Bearish, Mildly Bearish, Sideways, Mildly Bullish, Bullish Turned
 Shareholding Snapshot : Mar 2026
Shareholding Compare (%holding)
Promoters
None
Held by 0 Schemes
Held by 0 FIIs
Loko Hospitality Private Limited (84.11%)
Asset Reconstruction Company (india) Ltd.( Trust Holdings) (2.14%)
12.29%
Quarterly Results Snapshot (Consolidated) - Mar'26 - QoQ

QoQ Growth in quarter ended Mar 2026 is 25.12% vs 25.52% in Dec 2025
QoQ Growth in quarter ended Mar 2026 is -45.26% vs 150.23% in Dec 2025
Half Yearly Results Snapshot (Standalone) - Sep'25
Growth in half year ended Sep 2025 is -5.44% vs 13.88% in Sep 2024
Growth in half year ended Sep 2025 is -97.78% vs 2,131.64% in Sep 2024
Nine Monthly Results Snapshot (Standalone) - Dec'25
YoY Growth in nine months ended Dec 2025 is -2.73% vs 14.74% in Dec 2024
YoY Growth in nine months ended Dec 2025 is -82.10% vs 883.67% in Dec 2024
Annual Results Snapshot (Consolidated) - Mar'26

YoY Growth in year ended Mar 2026 is 4.30% vs -0.64% in Mar 2025
YoY Growth in year ended Mar 2026 is -76.51% vs 3,163.18% in Mar 2025
About Viceroy Hotels Ltd

Company Coordinates


