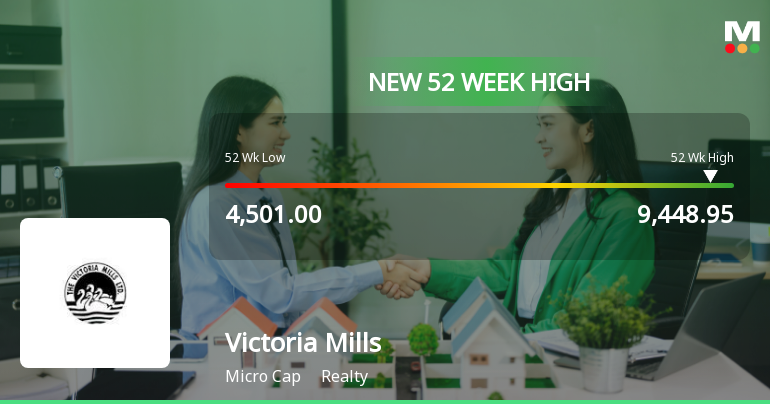
Victoria Mills

  • Market Cap: Micro Cap
  • Industry: Realty
  • ISIN: INE203D01016
  • NSEID:
  • BSEID: 503349
INR
8,341.25
34.4 (0.41%)
BSENSE

Sep 24, 03:30 PM

BSE+NSE Vol: 88

  • Price Points
  • Score
  • Mojo Parameters
  • Total Return
  • News and Corporate Actions
  • Key factors
  • Shareholding
  • Financials
  • CompanyCV
stock-summaryPrice Point
High/Low

1Day

52 Week

Valuation
Technical
Day's Volume

CASH

88 (47.65%) Volume

Shareholding (Jun 2026)

FII

0.00%

Held by 0 FIIs

DII

0.12%

Held by 0 DIIs

Promoter

56.16%

Why is Victoria Mills Ltd falling/rising?

06-Sep-2026

As of 05-Sep, the stock price of Victoria Mills Ltd is at 8,833.85, down 3.89% after a trend reversal. Despite a strong long-term performance, current indicators show decreased investor interest and trading activity.

As of 05-Sep, the stock price of Victoria Mills Ltd is falling, currently at 8,833.85, which represents a decrease of 357.15 or 3.89%. This decline follows a trend reversal after two consecutive days of gains. The stock has underperformed its sector by 2.8% today and reached an intraday low of Rs 8,731.45, marking a 5% drop. Additionally, there has been a significant decrease in investor participation, with delivery volume falling by 87.16% compared to the 5-day average. Despite the stock's strong performance over longer periods, such as a 74.07% increase over the past month, the current short-term indicators suggest a decline in interest and trading activity, contributing to the falling stock price.

View full answer

Who are in the management team of Victoria Mills?

01-Sep-2026

The management team of Victoria Mills includes Aditya Mangaldas as Chairman & Managing Director, Mamta Mangaldas as Non-Executive Director, and Suresh G. Vaidya and Gargi Mashruwala as Independent Directors.

The management team of Victoria Mills includes:<BR><BR>- **Aditya Mangaldas** who serves as the Chairman & Managing Director.<BR>- **Mamta Mangaldas** is a Non-Executive Director.<BR>- **Suresh G. Vaidya** holds the position of Independent Director.<BR>- **Gargi Mashruwala** is also an Independent Director.<BR><BR>If you need more details about their roles or the company's activities, feel free to ask!

View full answer

What does Victoria Mills do?

01-Sep-2026

Victoria Mills Ltd manufactures and sells textile products and operates in the micro-cap segment of the realty industry. As of June 2026, it reported net sales of 20 Cr and a net profit of 3 Cr, with a market cap of INR 90 Cr.

Overview:<BR>Victoria Mills Ltd is engaged in the manufacture and sale of various textile products, operating within the micro-cap segment of the realty industry.<BR><BR>History:<BR>Victoria Mills Limited was incorporated in January 1913. The latest quarterly results reported net sales and net profit for the period ending June 2026.<BR><BR>Financial Snapshot:<BR>Net Sales: 20 Cr (Quarterly Results - Jun 2026) <BR>Net Profit: 3 Cr (Quarterly Results - Jun 2026) <BR>Market Cap: INR 90 Cr (Micro Cap)<BR><BR>Key Metrics:<BR>P/E: 19.00 <BR>Industry P/E: 36 <BR>Dividend Yield: 0.54% <BR>Debt-Equity: -0.38 <BR>Return on Equity: 10.88% <BR>Price to Book: 1.28 <BR><BR>Contact Details:<BR>Address: Victoria House Lower Parel, Pandurang Bhudhkar Marg Mumbai Maharashtra : 400013 <BR>Tel: 91-22-24971192/93 <BR>Email: vicmill2013@gmail.com <BR>Website: http://www.victoriamills.in

View full answer

Who are the peers of the Victoria Mills?

01-Sep-2026

Victoria Mills' peers include Dharan Infra-EPC, Mega Nirman, Shervani Indl Sy, and others. In terms of management risk, growth, and capital structure, Victoria Mills shows average performance, with a 1-year return of 39.36%, outperforming Dharan Infra-EPC but underperforming Mega Nirman.

Peers: The peers of Victoria Mills are Dharan Infra-EPC, Mega Nirman, Shervani Indl Sy, Landmark Prop., Prerna Infra., Radhe Develop., Garnet Construct, H D I L, Shristi Infra, and Art Nirman Ltd.<BR><BR>Quality Snapshot: Excellent management risk is observed at Mega Nirman, while Average management risk is found at Shervani Indl Sy, Victoria Mills, and H D I L. Below Average management risk is noted at Dharan Infra-EPC, Landmark Prop., Prerna Infra., Radhe Develop., Garnet Construct, Shristi Infra, and Art Nirman Ltd. In terms of Growth, Excellent growth is seen at Victoria Mills and Mega Nirman, while Average growth is found at Radhe Develop. Below Average growth is noted at Dharan Infra-EPC, Shervani Indl Sy, Prerna Infra., Garnet Construct, H D I L, and Shristi Infra. For Capital Structure, Excellent capital structure is observed at Mega Nirman and Garnet Construct, Good capital structure is found at Victoria Mills, Shervani Indl Sy, and Prerna Infra., while Below Average capital structure is noted at Dharan Infra-EPC, Landmark Prop., Radhe Develop., H D I L, and Shristi Infra.<BR><BR>Return Snapshot: The peer with the highest 1-year return is Mega Nirman at 58.09%, while the peer with the lowest is Dharan Infra-EPC at -59.57%. Victoria Mills has a 1-year return of 39.36%, which is significantly higher than Dharan Infra-EPC but lower than Mega Nirman. Additionally, the six-month returns are negative for Dharan Infra-EPC, Shervani Indl Sy, Radhe Develop., H D I L, and Shristi Infra.

View full answer

How big is Victoria Mills?

01-Sep-2026

As of 31st August, Victoria Mills Ltd has a market capitalization of 90.00 Cr, with recent net sales of 41.44 Cr and a net profit of 4.87 Cr. The company reported shareholder's funds of 53.76 Cr and total assets of 66.06 Cr for the annual period ending March 2023.

As of 31st August, Victoria Mills Ltd has a market capitalization of 90.00 Cr, categorizing it as a Micro Cap company.<BR><BR>In the latest four quarters, Victoria Mills reported Net Sales of 41.44 Cr and a Net Profit of 4.87 Cr.<BR><BR>For the latest annual period ending in March 2023, the company had Shareholder's Funds of 53.76 Cr and Total Assets amounting to 66.06 Cr.

View full answer

Should I buy, sell or hold Victoria Mills Ltd?

01-Sep-2026

Are Victoria Mills Ltd latest results good or bad?

13-Feb-2026

Victoria Mills Ltd's latest results are concerning, showing a net loss of -₹0.07 crores and zero revenue for Q2 FY26, indicating significant operational challenges and a potential shift away from its core textile manufacturing business. The company's low return on equity and complete cessation of sales since Q2 FY24 raise serious questions about its future viability.

Victoria Mills Ltd's latest results indicate a troubling situation for the company. In Q2 FY26, the company reported a net profit of -₹0.07 crores, marking a loss-making quarter, and net sales of ₹0.00 crores, which signifies zero revenue. This operational cessation raises serious concerns about the company's business continuity, as it has not generated any sales since Q2 FY24.<BR><BR>The company's return on equity (ROE) is 6.06%, which is below industry standards, reflecting inefficient capital utilization. Additionally, the market capitalization stands at ₹63.00 crores, categorizing it as a micro-cap company. <BR><BR>While Victoria Mills has a strong balance sheet with zero long-term debt and a significant amount of current assets, the complete shutdown of its manufacturing operations poses significant risks. The absence of sales and the company's transformation into an investment holding entity rather than a textile manufacturer suggest a critical inflection point.<BR><BR>Overall, the results are quite concerning, indicating that the company is struggling significantly and may need to consider strategic alternatives to address its operational challenges.

View full answer

How has been the historical performance of Victoria Mills?

13-Nov-2025

Victoria Mills experienced a significant turnaround in March 2023, reporting net sales of 24.44 Cr and a profit after tax of 2.34 Cr, compared to losses in the previous year. The company's total assets and cash flow from operating activities also improved, indicating enhanced financial health.

Answer:<BR>The historical performance of Victoria Mills shows a fluctuating trend in its financial metrics over the years, with notable changes in net sales, profits, and overall financial health.<BR><BR>Breakdown:<BR>Victoria Mills reported net sales of 24.44 Cr in March 2023, a significant increase from 0.00 Cr in March 2022 and a rise from 17.86 Cr in March 2021. The total operating income also reached 24.44 Cr in March 2023, reflecting the same trend. However, raw material costs surged to 20.60 Cr in March 2023, compared to 0.00 Cr in the previous year, which contributed to total expenditure of 22.89 Cr. This resulted in an operating profit (PBDIT) of 3.16 Cr, a recovery from a loss of -1.40 Cr in March 2022. Profit before tax was 3.03 Cr in March 2023, up from -1.53 Cr the previous year, leading to a profit after tax of 2.34 Cr, compared to a loss of -1.54 Cr in March 2022. The company's total assets increased to 66.06 Cr in March 2023 from 58.55 Cr in March 2022, while total liabilities also rose to 66.06 Cr from 58.55 Cr. Cash flow from operating activities was positive at 2.00 Cr in March 2023, a recovery from -18.00 Cr in the previous year, indicating improved operational efficiency. Overall, the financial performance of Victoria Mills in March 2023 shows a positive turnaround compared to the previous year, with significant improvements in sales, profits, and cash flow.

View full answer

Who are the top shareholders of the Victoria Mills?

17-Jul-2025

The top shareholder of Victoria Mills is Aditya Harshavadan Mangaldas, holding 44.86%. Individual investors own 34.89%, while the highest public shareholder is Dipti K Somaiya at 1.69%.

The top shareholders of Victoria Mills are primarily the promoters, with Aditya Harshavadan Mangaldas holding the largest share at 44.86%. There are no pledged promoter holdings, and the company does not have any mutual funds or foreign institutional investors (FIIs) holding shares. The highest public shareholder is Dipti K Somaiya, who holds 1.69%. Additionally, individual investors collectively own 34.89% of the shares.

View full answer

Is Victoria Mills overvalued or undervalued?

09-Jun-2025

As of November 11, 2024, Victoria Mills is considered very attractive and undervalued, with a PE ratio of 13.09, an EV to EBITDA of 8.07, and a PEG ratio of 0.67, outperforming peers like XYZ Realty and the Sensex over the past three years.

As of 11 November 2024, the valuation grade for Victoria Mills has moved from attractive to very attractive. The company is currently assessed as undervalued. Key ratios include a PE ratio of 13.09, an EV to EBITDA of 8.07, and a PEG ratio of 0.67, indicating strong earnings potential relative to its price. <BR><BR>In comparison to peers, Victoria Mills' PE ratio is competitive with the industry average, while its EV to EBITDA ratio is also favorable, suggesting it is well-positioned against competitors. Notable peers include companies like XYZ Realty, which has a PE of 15.00, indicating that Victoria Mills may offer better value for investors. Additionally, the company's stock has significantly outperformed the Sensex over the past three years, returning 192.55% compared to the Sensex's 49.19%, reinforcing the valuation narrative.

View full answer

What is the technical trend for Victoria Mills?

09-Jun-2025

As of May 20, 2025, Victoria Mills shows a mildly bearish trend driven by daily moving averages, despite mixed signals from weekly and monthly indicators.

As of 20 May 2025, the technical trend for Victoria Mills has changed from sideways to mildly bearish. The current stance is mildly bearish, primarily driven by the daily moving averages indicating a bearish trend. The weekly MACD and KST are mildly bullish, but the monthly indicators show a bearish outlook, suggesting a mixed sentiment across different time frames. The Bollinger Bands are mildly bullish on both weekly and monthly charts, but the overall trend remains bearish due to the daily signals. The lack of clear trends in Dow Theory further supports a cautious approach.

View full answer

When is the next results date for Victoria Mills?

06-Jun-2025

No Upcoming Board Meetings

Has Victoria Mills declared dividend?

06-Jun-2025

Yes, Victoria Mills Ltd has declared a 50% dividend, amounting to 50 per share, with an ex-date of September 20, 2023. Despite this, the dividend yield is 0%, but the company has shown significant price returns over various periods, particularly a 244.06% increase over the last 5 years.

Victoria Mills Ltd has declared a 50% dividend.<BR><BR>Dividend Details:<BR>- Percentage announced: 50%<BR>- Amount per share: 50<BR>- Ex-date: 20 Sep 23<BR><BR>Dividend Yield: 0%<BR><BR>Total Returns by Period:<BR>In the last 6 months, the price return was -22.7%, the dividend return was 0%, resulting in a total return of -22.7%.<BR><BR>Over the past year, the price return was 57.59%, the dividend return was 0%, leading to a total return of 57.59%.<BR><BR>In the 2-year period, the price return was 125.52%, the dividend return was 1.81%, culminating in a total return of 127.33%.<BR><BR>For the 3-year period, the price return was 182.02%, the dividend return was 4.42%, resulting in a total return of 186.44%.<BR><BR>In the 4-year span, the price return was 116.64%, the dividend return was 5.93%, leading to a total return of 122.57%.<BR><BR>Finally, over the last 5 years, the price return was 244.06%, the dividend return was 9.78%, resulting in a total return of 253.84%.<BR><BR>Overall, while Victoria Mills has declared a dividend, the dividend yield remains at 0%. The total returns over the longer periods show significant growth, particularly in price returns, indicating a positive trend in the company's performance despite recent fluctuations.

View full answer
iScoreScore

Dashboard

1

Weak Long Term Fundamental Strength with an average Return on Equity (ROE) of 3.62%

  • Company's ability to service its debt is weak with a poor EBIT to Interest (avg) ratio of 1.83
2

With a growth in Net Sales of INF%, the company declared Very Positive results in Jun 26

3

With ROE of 10.9, it has a Very Attractive valuation with a 1.1 Price to Book Value

4

Majority shareholders : Promoters

 
5

Market Beating performance in long term as well as near term

stock-summaryMojo Parameters

Mojo Parameters

Loading Valuation Snapshot...

Stock DNA

stock-summary
Industry

Realty

stock-summary
Market cap

INR 82 Cr (Micro Cap)

stock-summary
P/E

17.00

stock-summary
Industry P/E

35

stock-summary
Dividend Yield

0.60%

stock-summary
Debt Equity

-0.38

stock-summary
Return on Equity

10.88%

stock-summary
Price to Book

1.14

Revenue and Profits:
Net Sales:
20 Cr
(Quarterly Results - Jun 2026)
Net Profit:
3 Cr
stock-summaryTotal Returns
Total Returns (Price + Dividend) stock-summary
Dividend Yield (0.6%)
TimePeriod
Price Return
Dividend Return
Total Return
3 Months
0%
0.94%
0.94%
6 Months
64.39%
1.02%
65.41%
1 Year
22.09%
0.77%
22.86%
2 Years
-5.21%
1.21%
-4.0%
3 Years
98.61%
2.70%
101.31%
4 Years
259.38%
6.56%
265.94%
5 Years
169.42%
6.35%
175.77%

Latest dividend: 49.99537778873413 per share ex-dividend date: Sep-18-2026

Risk Adjusted Returns v/s stock-summary
Returns Beta
Icon
Beta has not been calculated since enough price history is not available
stock-summaryNews & Corporate Actions

News

Victoria Mills Ltd Falls 5.05%: 4 Key Events Shaping the Week

Announcements stock-summary

Announcement under Regulation 30 (LODR)-Newspaper Publication

01-Sep-2026 | Source : BSE

Please final attached notice published in the newspaper

Reg. 34 (1) Annual Report.

26-Aug-2026 | Source : BSE

Annual Report for the Financial Year 2025-26

Notice Of The 113Th Annual General Meeting Of The Company For Financial Year 2025-26

26-Aug-2026 | Source : BSE

Notice of the 113th Annual General Meeting of the Company for Financial Year 2025-26.

Corporate Actions stock-summary

stock-summary
BOARD MEETING

No Upcoming Board Meetings

stock-summary
DIVIDEND

Victoria Mills Ltd has declared 50% dividend, ex-date: 18 Sep 26

stock-summary
SPLITS

No Splits history available

stock-summary
BONUS

No Bonus history available

stock-summary
RIGHTS

No Rights history available

stock-summaryKey Factors

Quality key factors stock-summary

Factor
Value
Sales Growth (5y)
25.68%
EBIT Growth (5y)
43.91%
EBIT to Interest (avg)
1.83
Debt to EBITDA (avg)
Negative Net Debt
Net Debt to Equity (avg)
-0.38
Sales to Capital Employed (avg)
0.46
Tax Ratio
21.33%
Dividend Payout Ratio
88.90%
Pledged Shares
0
Institutional Holding
0.12%
ROCE (avg)
1.56%
ROE (avg)
3.62%

Valuation key factors

Factor
Value
P/E Ratio
17
Industry P/E
35
Price to Book Value
1.15
EV to EBIT
8.11
EV to EBITDA
7.98
EV to Capital Employed
1.24
EV to Sales
0.98
PEG Ratio
0.02
Dividend Yield
0.60%
ROCE (Latest)
12.61%
ROE (Latest)
10.88%

Technicals key factors

Indicator
Weekly
Monthly
MACD
Bullish
Bullish
RSI
Bearish
No Signal
Bollinger Bands
Bullish
Mildly Bullish
Moving Averages
Bullish (Daily)
KST
Bullish
Mildly Bearish
Dow Theory
Mildly Bearish
Mildly Bullish
stock-summary Technical Indicator Scale: Bearish, Mildly Bearish, Sideways, Mildly Bullish, Bullish  Turned 
stock-summaryShareholding
Shareholding Snapshot : Jun 2026stock-summary
Shareholding Compare (%holding) stock-summary
Majority shareholders

Promoters

Pledged Promoter Holdings

None

Mutual Funds

Held by 0 Schemes

FIIs

Held by 0 FIIs

Promoter with highest holding

Aditya Harshavadan Mangaldas (44.86%)

Highest Public shareholder

Investor Education And Protection Fund Authority Ministry Of Corporate Affairs (3.42%)

Individual Investors Holdings

34.34%

stock-summaryFinancial
[
  {
    "link": "quarterly",
    "btn_text": "All Quarterly Results",
    "header": "Quarterly Results Snapshot (Standalone) - Jun'26 - QoQ",
    "rhs": [
      {
        "prefix": "Net Sales ",
        "suffix": "QoQ Growth in quarter ended Jun 2026 is 0.00% vs -100.00% in Mar 2026",
        "dir": 1
      },
      {
        "prefix": "Standalone Net Profit ",
        "suffix": "QoQ Growth in quarter ended Jun 2026 is 975.76% vs -112.50% in Mar 2026",
        "dir": 1
      }
    ],
    "table": {
      "header": [
        "Jun'26",
        "Mar'26",
        "Change(%)"
      ],
      "body": [
        {
          "field": "Net Sales",
          "val1": "19.50",
          "val2": "0.00",
          "chgp": "",
          "chgp_class": "neutral"
        },
        {
          "field": "Operating Profit (PBDIT) excl Other Income",
          "val1": "3.28",
          "val2": "-2.12",
          "chgp": "254.72%",
          "chgp_class": "positive"
        },
        {
          "field": "Interest",
          "val1": "0.00",
          "val2": "0.00",
          "chgp": "",
          "chgp_class": "neutral"
        },
        {
          "field": "Exceptional Items",
          "val1": "0.00",
          "val2": "0.00",
          "chgp": "",
          "chgp_class": "neutral"
        },
        {
          "field": "Standalone Net Profit",
          "val1": "2.89",
          "val2": "-0.33",
          "chgp": "975.76%",
          "chgp_class": "positive"
        },
        {
          "field": "Operating Profit Margin (Excl OI)",
          "val1": "16.82%",
          "val2": "0.00%",
          "chgp": "16.82%",
          "chgp_class": "positive"
        }
      ]
    }
  },
  {
    "link": "half-yearly",
    "btn_text": "All Half Yearly Results",
    "header": "Half Yearly Results Snapshot (Standalone) - Sep'25",
    "rhs": [
      {
        "prefix": "Net Sales ",
        "suffix": " Growth in half year ended Sep 2025 is 137.68% vs -16.47% in Sep 2024",
        "dir": 1
      },
      {
        "prefix": "Standalone Net Profit ",
        "suffix": " Growth in half year ended Sep 2025 is 4,744.44% vs -95.45% in Sep 2024",
        "dir": 1
      }
    ],
    "table": {
      "header": [
        "Sep'25",
        "Sep'24",
        "Change(%)"
      ],
      "body": [
        {
          "field": "Net Sales",
          "val1": "33.75",
          "val2": "14.20",
          "chgp": "137.68%",
          "chgp_class": "positive"
        },
        {
          "field": "Operating Profit (PBDIT) excl Other Income",
          "val1": "4.99",
          "val2": "0.14",
          "chgp": "3,464.29%",
          "chgp_class": "positive"
        },
        {
          "field": "Interest",
          "val1": "0.00",
          "val2": "0.00",
          "chgp": "",
          "chgp_class": "neutral"
        },
        {
          "field": "Exceptional Items",
          "val1": "0.00",
          "val2": "0.00",
          "chgp": "",
          "chgp_class": "neutral"
        },
        {
          "field": "Standalone Net Profit",
          "val1": "4.36",
          "val2": "0.09",
          "chgp": "4,744.44%",
          "chgp_class": "positive"
        },
        {
          "field": "Operating Profit Margin (Excl OI)",
          "val1": "14.79%",
          "val2": "0.99%",
          "chgp": "13.80%",
          "chgp_class": "positive"
        }
      ]
    }
  },
  {
    "link": "nine-monthly",
    "btn_text": "All Nine Monthly Results",
    "header": "Nine Monthly Results Snapshot (Standalone) - Dec'25",
    "rhs": [
      {
        "prefix": "Net Sales ",
        "suffix": "YoY Growth in nine months ended Dec 2025 is 76.13% vs 76.18% in Dec 2024",
        "dir": -1
      },
      {
        "prefix": "Standalone Net Profit ",
        "suffix": "YoY Growth in nine months ended Dec 2025 is 652.69% vs -48.90% in Dec 2024",
        "dir": 1
      }
    ],
    "table": {
      "header": [
        "Dec'25",
        "Dec'24",
        "Change(%)"
      ],
      "body": [
        {
          "field": "Net Sales",
          "val1": "52.75",
          "val2": "29.95",
          "chgp": "76.13%",
          "chgp_class": "positive"
        },
        {
          "field": "Operating Profit (PBDIT) excl Other Income",
          "val1": "7.83",
          "val2": "1.11",
          "chgp": "605.41%",
          "chgp_class": "positive"
        },
        {
          "field": "Interest",
          "val1": "0.00",
          "val2": "0.00",
          "chgp": "",
          "chgp_class": "neutral"
        },
        {
          "field": "Exceptional Items",
          "val1": "0.00",
          "val2": "0.00",
          "chgp": "",
          "chgp_class": "neutral"
        },
        {
          "field": "Standalone Net Profit",
          "val1": "7.00",
          "val2": "0.93",
          "chgp": "652.69%",
          "chgp_class": "positive"
        },
        {
          "field": "Operating Profit Margin (Excl OI)",
          "val1": "14.84%",
          "val2": "3.71%",
          "chgp": "11.13%",
          "chgp_class": "positive"
        }
      ]
    }
  },
  {
    "link": "annual",
    "btn_text": "All Annual Results",
    "header": "Annual Results Snapshot (Standalone) - Mar'26",
    "rhs": [
      {
        "prefix": "Net Sales ",
        "suffix": "YoY Growth in year ended Mar 2026 is 76.13% vs 76.18% in Mar 2025",
        "dir": -1
      },
      {
        "prefix": "Standalone Net Profit ",
        "suffix": "YoY Growth in year ended Mar 2026 is 1,110.91% vs -24.66% in Mar 2025",
        "dir": 1
      }
    ],
    "table": {
      "header": [
        "Mar'26",
        "Mar'25",
        "Change(%)"
      ],
      "body": [
        {
          "field": "Net Sales",
          "val1": "52.75",
          "val2": "29.95",
          "chgp": "76.13%",
          "chgp_class": "positive"
        },
        {
          "field": "Operating Profit (PBDIT) excl Other Income",
          "val1": "5.70",
          "val2": "0.55",
          "chgp": "936.36%",
          "chgp_class": "positive"
        },
        {
          "field": "Interest",
          "val1": "0.00",
          "val2": "0.00",
          "chgp": "",
          "chgp_class": "neutral"
        },
        {
          "field": "Exceptional Items",
          "val1": "0.00",
          "val2": "0.00",
          "chgp": "",
          "chgp_class": "neutral"
        },
        {
          "field": "Standalone Net Profit",
          "val1": "6.66",
          "val2": "0.55",
          "chgp": "1,110.91%",
          "chgp_class": "positive"
        },
        {
          "field": "Operating Profit Margin (Excl OI)",
          "val1": "10.81%",
          "val2": "1.84%",
          "chgp": "8.97%",
          "chgp_class": "positive"
        }
      ]
    }
  }
]

Quarterly Results Snapshot (Standalone) - Jun'26 - QoQstock-summary

Jun'26
Mar'26
Change(%)
Net Sales
19.50
0.00
Operating Profit (PBDIT) excl Other Income
3.28
-2.12
254.72%
Interest
0.00
0.00
Exceptional Items
0.00
0.00
Standalone Net Profit
2.89
-0.33
975.76%
Operating Profit Margin (Excl OI)
16.82%
0.00%
16.82%
Values in Rs Cr.
Direction Arrows
Net Sales

QoQ Growth in quarter ended Jun 2026 is 0.00% vs -100.00% in Mar 2026

Direction Arrows
Standalone Net Profit

QoQ Growth in quarter ended Jun 2026 is 975.76% vs -112.50% in Mar 2026

Half Yearly Results Snapshot (Standalone) - Sep'25stock-summary

Sep'25
Sep'24
Change(%)
Net Sales
33.75
14.20
137.68%
Operating Profit (PBDIT) excl Other Income
4.99
0.14
3,464.29%
Interest
0.00
0.00
Exceptional Items
0.00
0.00
Standalone Net Profit
4.36
0.09
4,744.44%
Operating Profit Margin (Excl OI)
14.79%
0.99%
13.80%
Values in Rs Cr.
Direction Arrows
Net Sales

Growth in half year ended Sep 2025 is 137.68% vs -16.47% in Sep 2024

Direction Arrows
Standalone Net Profit

Growth in half year ended Sep 2025 is 4,744.44% vs -95.45% in Sep 2024

Nine Monthly Results Snapshot (Standalone) - Dec'25stock-summary

Dec'25
Dec'24
Change(%)
Net Sales
52.75
29.95
76.13%
Operating Profit (PBDIT) excl Other Income
7.83
1.11
605.41%
Interest
0.00
0.00
Exceptional Items
0.00
0.00
Standalone Net Profit
7.00
0.93
652.69%
Operating Profit Margin (Excl OI)
14.84%
3.71%
11.13%
Values in Rs Cr.
Direction Arrows
Net Sales

YoY Growth in nine months ended Dec 2025 is 76.13% vs 76.18% in Dec 2024

Direction Arrows
Standalone Net Profit

YoY Growth in nine months ended Dec 2025 is 652.69% vs -48.90% in Dec 2024

Annual Results Snapshot (Standalone) - Mar'26stock-summary

Mar'26
Mar'25
Change(%)
Net Sales
52.75
29.95
76.13%
Operating Profit (PBDIT) excl Other Income
5.70
0.55
936.36%
Interest
0.00
0.00
Exceptional Items
0.00
0.00
Standalone Net Profit
6.66
0.55
1,110.91%
Operating Profit Margin (Excl OI)
10.81%
1.84%
8.97%
Values in Rs Cr.
Direction Arrows
Net Sales

YoY Growth in year ended Mar 2026 is 76.13% vs 76.18% in Mar 2025

Direction Arrows
Standalone Net Profit

YoY Growth in year ended Mar 2026 is 1,110.91% vs -24.66% in Mar 2025

stock-summaryCompany CV
About Victoria Mills Ltd stock-summary
stock-summary
Victoria Mills Ltd
Micro Cap
Realty
Victoria Mills Limited incorporated in January, 1913 is engaged in manufacture and sale of cloth, yarn and cotton waste, products manufactured are dhotis, sarees, shirting, printed poplin, volleys, grey and bleaching long cloth, gadlapat, coatings, etc. The dyeing calendaring, merchandising, yarn dyeing and manforising operations, counts ranging from 18s to 80s are spun and the cloth width ranges from 24 to 64.
Company Coordinates stock-summary
Company Details
Victoria House Lower Parel, Pandurang Bhudhkar Marg Mumbai Maharashtra : 400013
stock-summary
Tel: 91-22-24971192/93
stock-summary
vicmill2013@gmail.com
Registrar Details
Link Intime India Pvt Ltd, C-13 Pannalal Silk Compound, L B S Marg, Bhandup , Mumbai
Footer loading