
Compare Victoria's Secret & Co. with Similar Stocks
Total Returns (Price + Dividend) 
Victoria's Secret & Co. for the last several years.
Risk Adjusted Returns v/s
News
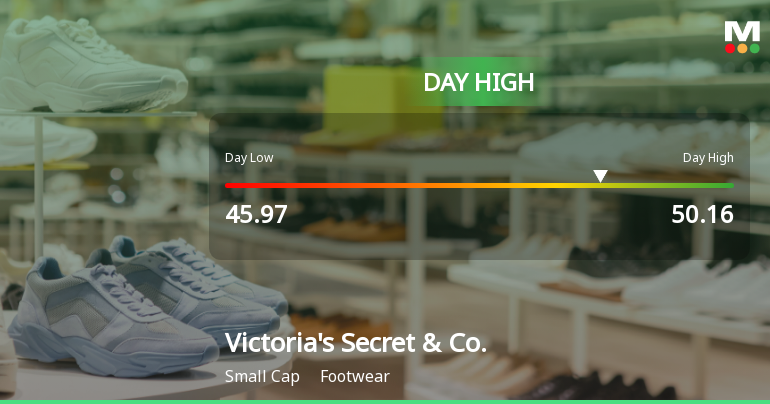
Victoria's Secret Hits Day High with 17.99% Surge in Stock Price
Victoria's Secret & Co. saw a notable increase in stock performance on December 5, 2025, reaching an intraday high. The company has outperformed the S&P 500 in various time frames, but faces long-term challenges, including declining net profit and a negative growth rate in operating profits over the past five years.
Read full news article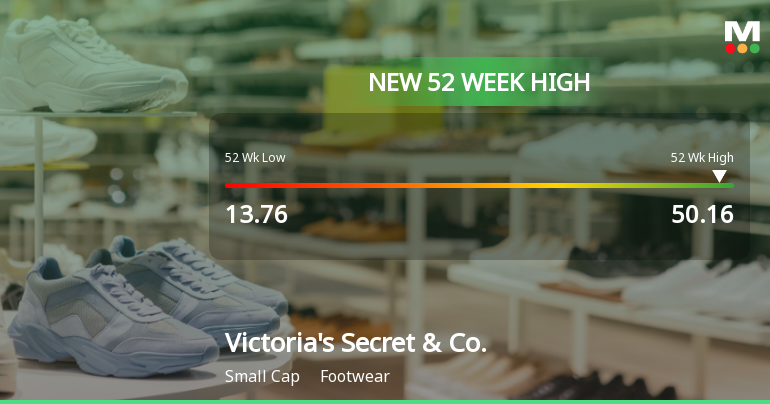
Victoria's Secret & Co. Hits New 52-Week High of $50.16
Victoria's Secret & Co. achieved a new 52-week high, reflecting a significant performance increase over the past year. With a market capitalization of USD 2,056 million, a P/E ratio of 9.00, and a return on equity of 26.37%, the company showcases strong financial health despite a higher debt-to-equity ratio.
Read full news article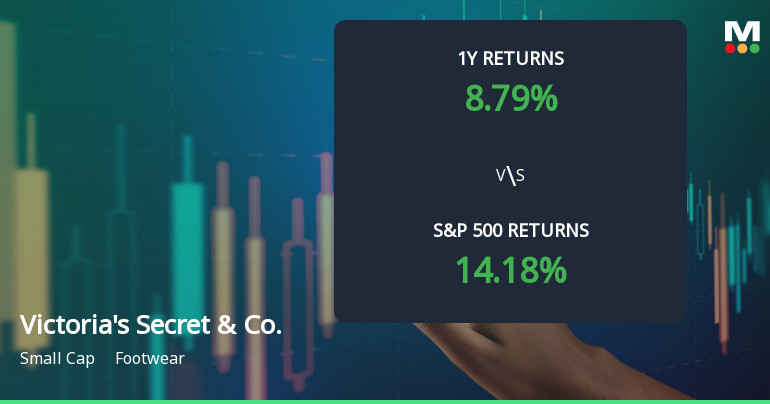
Victoria's Secret & Co. Experiences Evaluation Revision Amid Mixed Performance Indicators
Victoria's Secret & Co. has recently revised its evaluation amid fluctuating market conditions. The stock, priced at $41.33, has shown significant volatility over the past year. Performance indicators present a mixed outlook, with short-term returns surpassing the S&P 500, while longer-term results indicate a decline relative to the index.
Read full news article Announcements

Corporate Actions
Quality key factors
Valuation key factors
Technicals key factors
 Technical Indicator Scale: Bearish, Mildly Bearish, Sideways, Mildly Bullish, Bullish Turned
 Shareholding Snapshot : Oct 2025
Shareholding Compare (%holding)
Domestic Funds
Held in 81 Schemes (57.07%)
Held by 147 Foreign Institutions (12.47%)
Quarterly Results Snapshot (Consolidated) - Oct'25 - YoY

YoY Growth in quarter ended Oct 2025 is 9.28% vs 6.48% in Oct 2024
YoY Growth in quarter ended Oct 2025 is 43.64% vs 22.54% in Oct 2024
Annual Results Snapshot (Consolidated) - Jan'25
YoY Growth in year ended Jan 2025 is 0.78% vs -2.55% in Jan 2024
YoY Growth in year ended Jan 2025 is 45.69% vs -65.68% in Jan 2024
About Victoria's Secret & Co.

Company Coordinates


