
Compare Vidya Wires with Similar Stocks
Dashboard
The company is Net-Debt Free
Healthy long term growth as Operating profit has grown by an annual rate 0%
With a growth in Net Profit of 40.1%, the company declared Very Positive results in Mar 26
With ROE of 12.5, it has a Attractive valuation with a 4.3 Price to Book Value
Increasing Participation by Institutional Investors
Stock DNA
Industrial Products
INR 2,134 Cr (Micro Cap)
36.00
39
0.00%
-0.01
12.46%
4.36
Total Returns (Price + Dividend) 
Vidya Wires for the last several years.
Risk Adjusted Returns v/s
Returns Beta

News
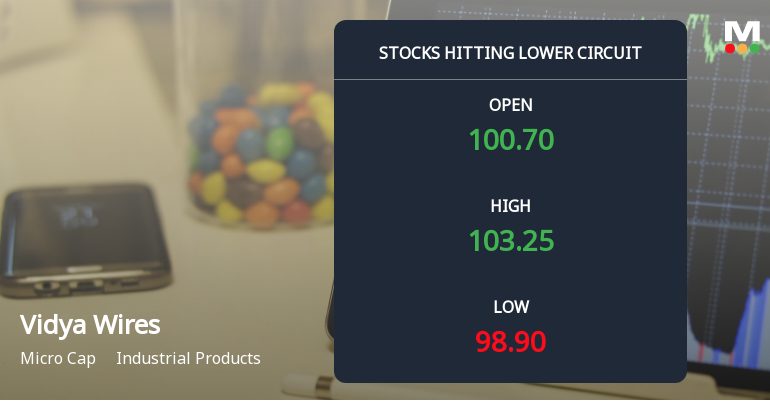
Vidya Wires Ltd Locks at Lower Circuit With 5.0% Loss — Sellers Queue, No Buyers in Sight
At Rs 98.87, sellers were still queuing — but there were no buyers willing to take the other side. Vidya Wires Ltd locked at its lower circuit of 5.0% on 24 Jun 2026, with unfilled sell orders and a frozen price, reflecting persistent selling pressure in a micro-cap stock.
Read full news article
Vidya Wires Ltd Locks at Lower Circuit With 5% Loss — Sellers Queue, No Buyers in Sight
At Rs 104.07, sellers were still queuing — but there were no buyers willing to take the other side. Vidya Wires Ltd locked at its lower circuit of 5% on 23 Jun 2026, with unfilled sell orders and a frozen price, reflecting persistent selling pressure in a micro-cap stock with limited liquidity.
Read full news article
Vidya Wires Ltd Shows Renewed Momentum with Technical Upgrades and Strong Returns
Vidya Wires Ltd, a micro-cap player in the Industrial Products sector, has demonstrated a notable shift in price momentum and technical indicators, signalling a mild bullish trend after a period of sideways movement. The company’s stock price has surged to ₹109.55, up 2.19% from the previous close of ₹107.20, reflecting growing investor confidence amid improving technical signals and robust returns compared to the broader market.
Read full news article Announcements
Closure of Trading Window
23-Jun-2026 | Source : BSEEnclosed herewith Initmation of Closure of Trading Window for the First quarter and three months period to be ended on June 30 2026.
Closure of Trading Window
23-Jun-2026 | Source : BSEEnclosed herewith Intimation of Closure of Trading Window for the First Quarter and Three Months period to be ended on June 30 2026.
Receipt Of Assessment Order From The Income Tax Department For The Block Period From 01.04.2018 To 23.04.2025
01-Jun-2026 | Source : BSEDisclosure of Communication under Regulation 30(13) of the SEBI (LODR) from Income tax Department
Corporate Actions

No Upcoming Board Meetings

No Dividend history available

No Splits history available

No Bonus history available

No Rights history available
Quality key factors
Valuation key factors
Technicals key factors
 Technical Indicator Scale: Bearish, Mildly Bearish, Sideways, Mildly Bullish, Bullish Turned
 Shareholding Snapshot : Mar 2026
Shareholding Compare (%holding)
Promoters
None
Held by 3 Schemes (9.02%)
Held by 4 FIIs (1.12%)
Shailesh Rathi (34.55%)
Bandhan Small Cap Fund (4.25%)
13.28%
Quarterly Results Snapshot (Standalone) - Mar'26 - QoQ

QoQ Growth in quarter ended Mar 2026 is 31.39% vs 17.65% in Dec 2025

QoQ Growth in quarter ended Mar 2026 is 40.10% vs 48.76% in Dec 2025
Half Yearly Results Snapshot (Standalone) - Sep'25
Not Applicable: The company has declared_date for only one period
Not Applicable: The company has declared_date for only one period
Nine Monthly Results Snapshot (Standalone) - Dec'25
Not Applicable: The company has declared_date for only one period
Not Applicable: The company has declared_date for only one period
Annual Results Snapshot (Consolidated) - Mar'26
YoY Growth in year ended Mar 2026 is 24.24% vs 24.85% in Mar 2025
YoY Growth in year ended Mar 2026 is 42.16% vs 57.88% in Mar 2025
About Vidya Wires Ltd

Company Coordinates


