
Compare Vikram Aroma with Similar Stocks
Dashboard
Weak Long Term Fundamental Strength with an average Return on Equity (ROE) of 0%
- Poor long term growth as Net Sales has grown by an annual rate of -3.80% over the last 5 years
- Company's ability to service its debt is weak with a poor EBIT to Interest (avg) ratio of -0.88
Flat results in Mar 26
Risky - Negative Operating Profits
Underperformed the market in the last 1 year
Stock DNA
Specialty Chemicals
INR 23 Cr (Micro Cap)
NA (Loss Making)
46
0.00%
0.12
-1.85%
1.09
Total Returns (Price + Dividend) 
Vikram Aroma for the last several years.
Risk Adjusted Returns v/s
Returns Beta

News
Are Vikram Aroma Ltd latest results good or bad?
Vikram Aroma Ltd's latest financial results for Q4 FY26 indicate a complex operational landscape. The company reported a net profit of ₹0.16 crore, marking a return to profitability after a loss in the previous quarter. This turnaround was supported by a significant revenue increase of 55.25% quarter-on-quarter, bringing total revenue to ₹7.39 crore. However, this figure remains below the ₹9.35 crore achieved in Q2 FY25, highlighting ongoing revenue volatility. The operating margin for the quarter was recorded at 4.06%, which is a decline from 5.25% in the previous quarter, suggesting challenges in maintaining profitability despite the revenue growth. The profit after tax (PAT) margin improved to 2.17%, up from a negative margin in the prior quarter, yet this improvement was largely influenced by a favorable tax credit rather than operational strength. Despite the quarterly profit, Vikram Aroma's full-yea...
Read full news article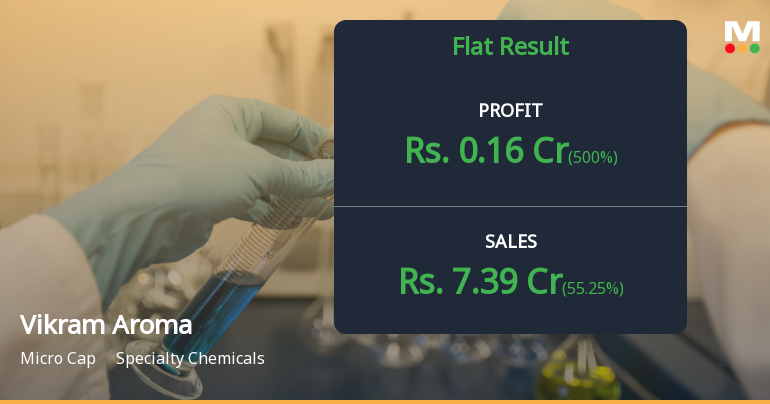
Vikram Aroma Q4 FY26: Micro-Cap Chemical Maker Posts Profit After Four Loss-Making Quarters
Vikram Aroma Ltd., a micro-cap speciality chemicals manufacturer focused on diphenyl oxide production, reported a modest return to profitability in Q4 FY26 (Mar'26) with net profit of ₹0.16 crores, marking its first profitable quarter after four consecutive quarters of losses. However, the company's shares remain under severe pressure, trading at ₹65.18 with a market capitalisation of just ₹20.00 crores, down 50.99% over the past year despite a 3.38% gain in the latest trading session.
Read full news article Announcements
Compliances-Certificate under Reg. 74 (5) of SEBI (DP) Regulations 2018
11-Jul-2026 | Source : BSEBased on the certificate received from Bigshare Services Pvt. Ltd RTA of the company we hereby certify that the securities received for dematerialization have been mutilated and cancelled after due verification and the name of the depository has been substituted in our records as registered owner within the stipulated time of receipt of certificate of security.
Closure of Trading Window
27-Jun-2026 | Source : BSENotice is hereby given that the trading window for dealing in securities of the company shall remain closed with effect 01-07-2026 till the end of 48 hours after the declaration of unaudited financial results for the quarter ended 30-06-2026 (both days inclusive) for all the designated persons of the company and their immediate relatives.
Disclosures under Reg. 29(2) of SEBI (SAST) Regulations 2011
11-Jun-2026 | Source : BSEThe Exchange has received the disclosure under Regulation 29(2) of SEBI (Substantial Acquisition of Shares & Takeovers) Regulations 2011 for Ghanshyambhai Patel & PACs
Corporate Actions

No Upcoming Board Meetings

No Dividend history available

No Splits history available

No Bonus history available

No Rights history available
Quality key factors
Valuation key factors
Technicals key factors
 Technical Indicator Scale: Bearish, Mildly Bearish, Sideways, Mildly Bullish, Bullish Turned
 Shareholding Snapshot : Jun 2026
Shareholding Compare (%holding)
Promoters
None
Held by 0 Schemes
Held by 0 FIIs
Ghanshyambhai Karsandas Patel (9.57%)
Vikram Aroma Limited (1.65%)
28.2%
Quarterly Results Snapshot (Standalone) - Mar'26 - QoQ

QoQ Growth in quarter ended Mar 2026 is 55.25% vs -20.80% in Dec 2025
QoQ Growth in quarter ended Mar 2026 is 500.00% vs 92.98% in Dec 2025
Half Yearly Results Snapshot (Standalone) - Sep'25
Not Applicable: The company has declared_date for only one period
Not Applicable: The company has declared_date for only one period
Nine Monthly Results Snapshot (Standalone) - Dec'25
Not Applicable: The company has declared_date for only one period
Not Applicable: The company has declared_date for only one period
Annual Results Snapshot (Standalone) - Mar'26

YoY Growth in year ended Mar 2026 is -17.38% vs 12.02% in Mar 2025
YoY Growth in year ended Mar 2026 is 74.67% vs -248.84% in Mar 2025
About Vikram Aroma Ltd

Company Coordinates


