
Compare Vikram Solar with Similar Stocks
Dashboard
Company has a Debt to Equity ratio (avg) of 0.99 times
Healthy long term growth as Net Sales has grown by an annual rate of 30.50% and Operating profit at 68.45%
Flat results in Mar 26
With ROE of 16, it has a Very Attractive valuation with a 2.3 Price to Book Value
Increasing Participation by Institutional Investors
Stock DNA
Other Electrical Equipment
INR 6,714 Cr (Small Cap)
14.00
NA
0.00%
-0.49
15.98%
2.31
Total Returns (Price + Dividend) 
Vikram Solar for the last several years.
Risk Adjusted Returns v/s
Returns Beta

News
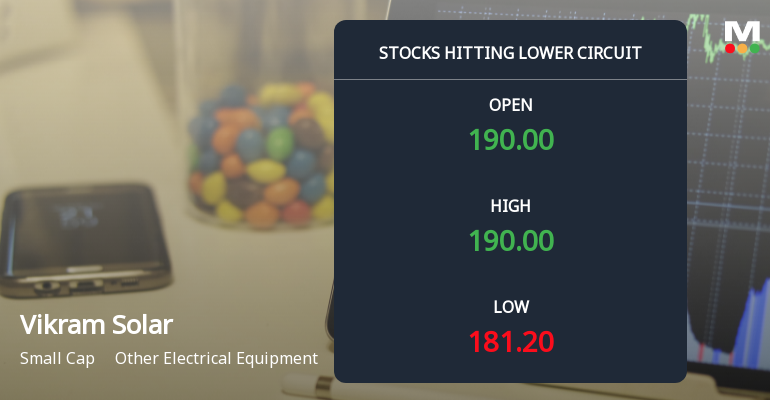
Vikram Solar Ltd Locks at Lower Circuit With 5% Loss — Sellers Queue, No Buyers in Sight
At Rs 180.76, sellers were still queuing — but there were no buyers willing to take the other side. Vikram Solar Ltd locked at its lower circuit of 5% on 24 Jun 2026, with unfilled sell orders and a frozen price, signalling a pronounced imbalance in supply and demand.
Read full news article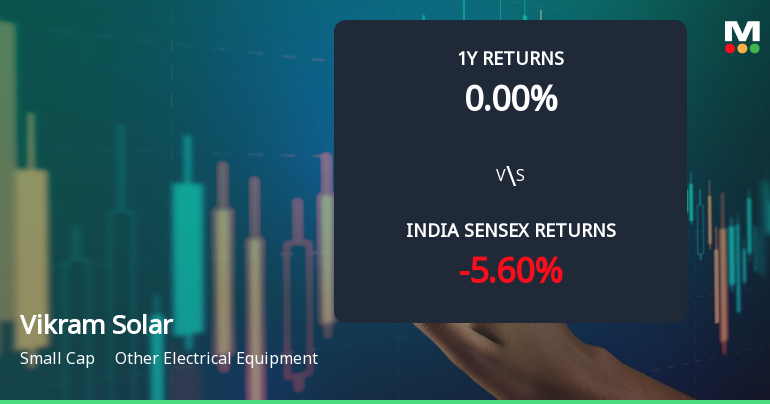
Vikram Solar Ltd Technical Momentum Shifts Amid Market Pressure
Vikram Solar Ltd, a small-cap player in the Other Electrical Equipment sector, has experienced a notable shift in its technical momentum, moving from a sideways trend to a mildly bearish stance. Recent technical indicators reveal a complex picture with mixed signals from MACD, RSI, moving averages, and other momentum tools, reflecting the stock’s struggle amid broader market pressures and sectoral challenges.
Read full news article
Vikram Solar Ltd is Rated Hold by MarketsMOJO
Vikram Solar Ltd is rated 'Hold' by MarketsMOJO, a rating that was last updated on 06 May 2026. While this rating change occurred over a month ago, the analysis and financial metrics discussed here reflect the company’s current position as of 20 June 2026, providing investors with an up-to-date perspective on the stock’s fundamentals, valuation, financial trends, and technical outlook.
Read full news article Announcements
Corporate Actions

No Upcoming Board Meetings

No Dividend history available

No Splits history available

No Bonus history available

No Rights history available
Quality key factors
Valuation key factors
Technicals key factors
 Technical Indicator Scale: Bearish, Mildly Bearish, Sideways, Mildly Bullish, Bullish Turned
 Shareholding Snapshot : Mar 2026
Shareholding Compare (%holding)
Promoters
6.7667
Held by 11 Schemes (3.84%)
Held by 15 FIIs (2.94%)
Vikram Capital Management Private Limited (30.85%)
Arpit Khandelwal (2.76%)
20.61%
Quarterly Results Snapshot (Standalone) - Mar'26 - QoQ

QoQ Growth in quarter ended Mar 2026 is 31.37% vs -0.37% in Dec 2025
QoQ Growth in quarter ended Mar 2026 is 14.03% vs -24.80% in Dec 2025
Half Yearly Results Snapshot (Standalone) - Sep'25
Not Applicable: The company has declared_date for only one period
Not Applicable: The company has declared_date for only one period
Nine Monthly Results Snapshot (Standalone) - Dec'25
Not Applicable: The company has declared_date for only one period
Not Applicable: The company has declared_date for only one period
Annual Results Snapshot (Standalone) - Mar'26
YoY Growth in year ended Mar 2026 is 40.64% vs 39.93% in Mar 2025
YoY Growth in year ended Mar 2026 is 237.21% vs 108.17% in Mar 2025
About Vikram Solar Ltd

Company Coordinates


