Vikram Thermo

  • Market Cap: Micro Cap
  • Industry: Commodity Chemicals
  • ISIN: INE337E01010
  • NSEID:
  • BSEID: 530477
INR
306.00
0.85 (0.28%)
BSENSE

Sep 02, 12:03 PM

BSE+NSE Vol: 8.13 k

  • Price Points
  • Score
  • Mojo Parameters
  • Total Return
  • News and Corporate Actions
  • Key factors
  • Shareholding
  • Financials
  • CompanyCV
stock-summaryPrice Point
High/Low

1Day

52 Week

Valuation
Technical
Day's Volume

CASH

8.13 k (-10.66%) Volume

Shareholding (Jun 2026)

FII

0.00%

Held by 0 FIIs

DII

0.26%

Held by 0 DIIs

Promoter

66.01%

Why is Vikram Thermo (India) Ltd falling/rising?

02-Sep-2026

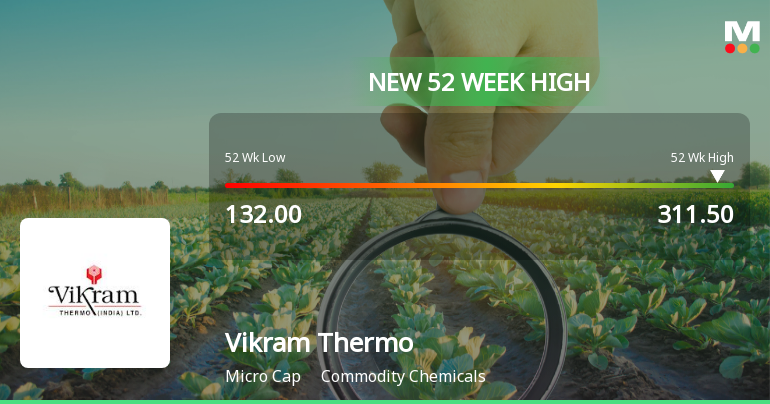
As of 01-Sep, Vikram Thermo (India) Ltd's stock price has risen to 305.15, reflecting a 2.35% increase, driven by strong historical performance and heightened investor confidence, including a recent 52-week high. The stock has outperformed the Sensex significantly, with an 88.89% year-to-date surge and increased trading activity.

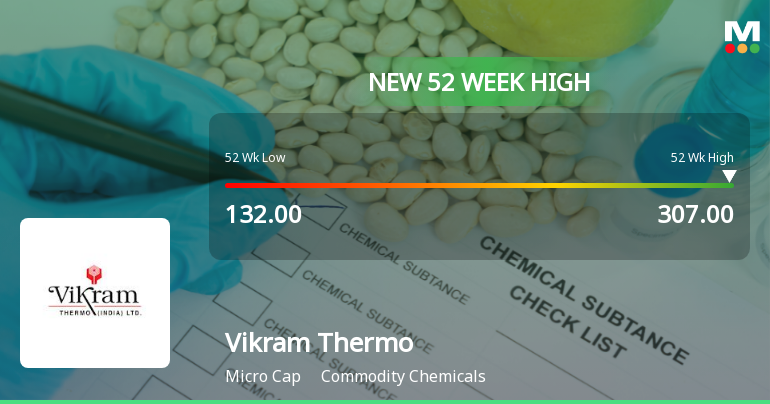
As of 01-Sep, Vikram Thermo (India) Ltd is experiencing a rise in its stock price, currently at 305.15, reflecting a change of 7.0 or 2.35% increase. This upward movement can be attributed to several key factors. <BR><BR>Firstly, the stock has shown strong performance over various time periods, with a notable increase of 24.55% over the past month, significantly outperforming the Sensex, which declined by 1.47% during the same period. Year-to-date, the stock has surged by 88.89%, while the Sensex has fallen by 9.71%. This trend indicates robust investor confidence and demand for the stock.<BR><BR>Additionally, today marks a new 52-week high for Vikram Thermo, reaching Rs.307, which further emphasizes the stock's upward momentum. The stock has also been on a consecutive gain streak for the last five days, accumulating a total return of 5.74% in this period. <BR><BR>Moreover, the stock is trading above its 5-day, 20-day, 50-day, 100-day, and 200-day moving averages, suggesting a strong bullish trend. Increased investor participation is evident, with a delivery volume of 25.06k on August 31, which has risen by 22.51% compared to the 5-day average. This indicates heightened interest and confidence among investors.<BR><BR>Overall, the combination of strong historical performance, recent price achievements, and increased trading activity contributes to the rising stock price of Vikram Thermo (India) Ltd.

View full answer

Who are in the management team of Vikram Thermo?

01-Sep-2026

The management team of Vikram Thermo includes Dhirajbhai Karsandas Patel (Chairman & Managing Director), D H Patel, Ankur D Patel (both Whole-time Directors), and several Independent and Non-Executive Directors. They oversee the company's operations and strategic direction.

The management team of Vikram Thermo includes the following individuals:<BR><BR>1. **Dhirajbhai Karsandas Patel** - Chairman & Managing Director<BR>2. **D H Patel** - Whole-time Director<BR>3. **Ankur D Patel** - Whole-time Director<BR>4. **Bharatbhai M Shah** - Independent Non-Executive Director<BR>5. **Ketanbhai C Patel** - Independent Non-Executive Director<BR>6. **Thakarshibhai M Patel** - Independent Non-Executive Director<BR>7. **Alpaben Alpeshbhai Patel** - Non-Executive & Non-Independent Director<BR>8. **Shailesh P Patel** - Independent Non-Executive Director<BR>9. **Vipulkumar Vitthalbhai Patel** - Independent Non-Executive Director<BR><BR>This team is responsible for overseeing the company's operations and strategic direction.

View full answer

What does Vikram Thermo do?

01-Sep-2026

Vikram Thermo (India) Ltd is a manufacturer and exporter of pharmaceutical excipients, focusing on Film Coating, Enteric Coating, and Sustain Release formulations. As of June 2026, it reported net sales of 38 Cr and a net profit of 13 Cr, with a market cap of INR 950 Cr.

Overview:<BR>Vikram Thermo (India) Ltd is a manufacturer, marketer, and exporter of pharmaceutical excipients, specializing in Film Coating, Enteric Coating, and Sustain Release/Control Release formulations within the Commodity Chemicals industry, classified as a Micro Cap company.<BR><BR>History:<BR>Vikram Thermo (India) Ltd was incorporated in an unspecified year and has established itself as one of the fastest-growing pharmaceutical companies. The latest quarterly results reported are for June 2026, showing net sales and profit figures.<BR><BR>Financial Snapshot:<BR>- Net Sales: 38 Cr (Quarterly Results - Jun 2026)<BR>- Net Profit: 13 Cr (Quarterly Results - Jun 2026)<BR>- Market-cap: INR 950 Cr (Micro Cap)<BR><BR>Key Metrics:<BR>- P/E: 21.00<BR>- Industry P/E: 43<BR>- Dividend Yield: 0.34%<BR>- Debt-Equity: -0.06<BR>- Return on Equity: 31.93%<BR>- Price to Book: 6.75<BR><BR>Contact Details:<BR>Address: A/704-714 The Capital, Science City Road Ahmedabad Gujarat : 380060<BR>Email: exports@vikramthermo.com<BR>Website: http://www.vikramthermo.com

View full answer

Who are the peers of the Vikram Thermo?

01-Sep-2026

Vikram Thermo's peers include I G Petrochems, Indo Borax & Ch., and Andhra Sugars, among others. Vikram Thermo has average management risk and a 1-year return of 81.03%, lower than Indo Borax & Ch.'s 112.91% but higher than TGV Sraac's -16.88%.

Peers: The peers of Vikram Thermo are I G Petrochems, Indo Borax & Ch., Andhra Sugars, TGV Sraac, Amines & Plast., Sadhana Nitro, Sr.Rayala.Hypo, OCCL, and Transpek Inds.<BR><BR>Quality Snapshot: Excellent management risk is observed at I G Petrochems, Indo Borax & Ch., Andhra Sugars, Sr.Rayala.Hypo, OCCL, and Transpek Inds., while Average management risk is found at TGV Sraac, Amines & Plast., and Vikram Thermo, and the rest. Below Average management risk is noted for Sadhana Nitro. Growth ratings show that Excellent growth is present at OCCL, while Average growth is found at Vikram Thermo, and the rest have Below Average growth. Capital Structure is Excellent for I G Petrochems, Indo Borax & Ch., Vikram Thermo, Sr.Rayala.Hypo, Transpek Inds., and the rest have Good or Below Average ratings.<BR><BR>Return Snapshot: Indo Borax & Ch. has the highest 1-year return at 112.91%, while TGV Sraac has the lowest at -16.88%. Vikram Thermo's 1-year return of 81.03% is significantly higher than TGV Sraac's but lower than Indo Borax & Ch.'s. Additionally, Sadhana Nitro and Amines & Plast. have negative six-month returns.

View full answer

How big is Vikram Thermo?

01-Sep-2026

As of 31st August, Vikram Thermo (India) Ltd has a market capitalization of 950.00 Cr, with recent net sales of 144.30 Cr and a net profit of 43.84 Cr.

As of 31st August, Vikram Thermo (India) Ltd has a market capitalization of 950.00 Cr, categorizing it as a Micro Cap company.<BR><BR>In the latest four quarters, Vikram Thermo reported Net Sales of 144.30 Cr and a Net Profit of 43.84 Cr.<BR><BR>The latest annual period for the balance sheet is March 2025, with Shareholder's Funds amounting to 121.45 Cr and Total Assets of 145.89 Cr.

View full answer

Should I buy, sell or hold Vikram Thermo (India) Ltd?

13-Aug-2026

When is the next results date for Vikram Thermo (India) Ltd?

04-Aug-2026

The next results date for Vikram Thermo (India) Ltd is 11 August 2026.

The next results date for Vikram Thermo (India) Ltd is scheduled for 11 August 2026.

View full answer

Are Vikram Thermo (India) Ltd latest results good or bad?

27-May-2026

Vikram Thermo (India) Ltd's latest results show strong revenue growth of 11.02% QoQ and 39.32% YoY, reaching ₹37.77 crores, but profitability declined with a net profit drop of 22.26% QoQ and a significant fall in operating margins. While revenue growth is positive, the decrease in profitability raises concerns about the company's cost structure.

Vikram Thermo (India) Ltd's latest results present a mixed picture. On one hand, the company achieved a significant revenue growth of 11.02% quarter-on-quarter (QoQ) and an impressive 39.32% year-on-year (YoY), reaching a record high of ₹37.77 crores in Q4 FY26. This indicates strong demand for its pharmaceutical excipients.<BR><BR>However, profitability has taken a hit. The net profit for the quarter was ₹8.52 crores, which represents a decline of 22.26% QoQ, although it shows a substantial increase of 109.34% YoY. The operating margin, excluding other income, fell sharply by 1,283 basis points to 31.67%, down from 44.50% in the previous quarter. This margin compression raises concerns about the sustainability of the company's cost structure, especially given the sequential profit decline despite revenue growth.<BR><BR>Overall, while the revenue growth is a positive sign, the significant drop in profitability and operating margins suggests that the company is facing challenges that need to be addressed. Investors may want to monitor these trends closely before making decisions.

View full answer

Is Vikram Thermo technically bullish or bearish?

02-Dec-2025

As of December 1, 2025, Vikram Thermo's technical trend is mildly bearish, driven by mixed indicators such as a bullish weekly MACD and bearish monthly MACD, alongside bearish daily moving averages and neutral signals from RSI and Dow Theory.

As of 1 December 2025, the technical trend has changed from sideways to mildly bearish. The current technical stance for Vikram Thermo is mildly bearish. Key indicators driving this stance include the weekly MACD being bullish, while the monthly MACD and KST are both mildly bearish. The daily moving averages indicate a bearish trend, and the Bollinger Bands show a mildly bullish signal on the weekly timeframe but sideways on the monthly. The lack of clear signals from the RSI and Dow Theory further supports a neutral outlook in those timeframes. Overall, the combination of these indicators suggests a cautious bearish sentiment in the current market context.

View full answer

How has been the historical performance of Vikram Thermo?

17-Nov-2025

Vikram Thermo has shown significant growth in financial metrics, with net sales rising from 55.85 Cr in Mar'20 to 126.23 Cr in Mar'25, and profit before tax increasing from 6.16 Cr to 44.14 Cr in the same period, despite some fluctuations in earnings per share. Total assets and liabilities both grew to 145.89 Cr by Mar'25, indicating a robust growth pattern in revenue and profitability.

Answer:<BR>The historical performance of Vikram Thermo shows a significant growth trajectory in its financial metrics over the years.<BR><BR>Breakdown:<BR>Vikram Thermo's net sales increased from 55.85 Cr in Mar'20 to 126.23 Cr in Mar'25, reflecting a strong upward trend despite a dip in Mar'23. The total operating income followed a similar pattern, rising from 58.24 Cr in Mar'19 to 126.23 Cr in Mar'25. The company's operating profit (PBDIT) also saw substantial growth, reaching 47.60 Cr in Mar'25, up from 9.12 Cr in Mar'19. Profit before tax increased from 6.16 Cr in Mar'19 to 44.14 Cr in Mar'25, while profit after tax rose from 4.43 Cr to 33.76 Cr in the same period. The earnings per share (EPS) fluctuated, peaking at 11.55 in Mar'20 before declining to 2.58 in Mar'25. The company's total assets grew from 73.20 Cr in Mar'20 to 145.89 Cr in Mar'25, and total liabilities increased from 73.20 Cr to 145.89 Cr over the same period. Cash flow from operating activities remained stable at 23.00 Cr in Mar'25, while cash flow from investing activities showed a negative trend, indicating increased investment outflows. Overall, Vikram Thermo has demonstrated a robust growth pattern in revenue and profitability, alongside a steady increase in assets and liabilities.

View full answer

Is Vikram Thermo overvalued or undervalued?

22-Aug-2025

As of August 21, 2025, Vikram Thermo is considered very expensive and overvalued with a PE Ratio of 15.82, an EV to EBITDA of 11.98, and a Price to Book Value of 4.27, especially when compared to peers like Solar Industries and Godrej Industries, and it has underperformed the Sensex with a year-to-date return of -5.17%.

As of 21 August 2025, the valuation grade for Vikram Thermo has moved from expensive to very expensive, indicating a significant shift in its perceived market value. The company is currently overvalued based on its financial metrics. Key ratios include a PE Ratio of 15.82, an EV to EBITDA of 11.98, and a Price to Book Value of 4.27, which are high relative to industry standards.<BR><BR>When compared to peers, Vikram Thermo's valuation stands out as excessive, especially against Solar Industries, which has a PE of 105.13, and Godrej Industries, which is more attractively valued at a PE of 42.99. Additionally, while Vikram Thermo has shown strong returns over the long term, its recent performance has lagged behind the Sensex, with a year-to-date return of -5.17% compared to the Sensex's 4.94%. This further reinforces the conclusion that the stock is currently overvalued.

View full answer

Who are the top shareholders of the Vikram Thermo?

17-Jul-2025

The top shareholder of Vikram Thermo is Dhirajlal Karsanbhai Patel, holding 18.45%, with no pledged promoter holdings. The highest public shareholder is Basava Sankararao Kolli at 2.15%, and individual investors collectively own 27.85% of the shares.

The top shareholders of Vikram Thermo include the promoters, with Dhirajlal Karsanbhai Patel holding the largest share at 18.45%. There are no pledged promoter holdings, and the company does not have any mutual funds or foreign institutional investors (FIIs) holding shares. The highest public shareholder is Basava Sankararao Kolli, who owns 2.15%. Additionally, individual investors collectively hold 27.85% of the company's shares.

View full answer

What is the bonus history of the Vikram Thermo?

06-Jun-2025

Vikram Thermo announced a 4:1 bonus issue, with an ex-date of May 12, 2022, and a record date of May 13, 2022, allowing shareholders to receive four additional shares for each share held.

Vikram Thermo has a recent bonus history where it announced a 4:1 bonus issue. The ex-date for this bonus was on May 12, 2022, and the record date was May 13, 2022. This means that shareholders received four additional shares for every one share they held as of the record date. If you have any more questions about the company or its financial activities, feel free to ask!

View full answer

Has Vikram Thermo declared dividend?

06-Jun-2025

Yes, Vikram Thermo (India) Ltd has declared a 7% dividend, amounting to ₹0.7 per share, with an ex-date of September 23, 2024. While recent returns have been negative, the company has shown significant growth over the longer term, particularly with a total return of 901.87% over the past five years.

Vikram Thermo (India) Ltd has declared a 7% dividend.<BR><BR>Dividend Details:<BR>- Percentage announced: 7%<BR>- Amount per share: 0.7<BR>- Ex-date: 23 Sep 24<BR><BR>Dividend Yield: 0.42%.<BR><BR>Total Returns by Period:<BR>In the last 6 months, the price return was -2.59%, with a dividend return of 0%, resulting in a total return of -2.59%.<BR><BR>Over the past year, the price return was -5.5%, with a dividend return of 0.38%, leading to a total return of -5.12%.<BR><BR>In the 2-year period, the price return was 104.01%, accompanied by a dividend return of 1.35%, culminating in a total return of 105.36%.<BR><BR>For the 3-year period, the price return was 327.78%, with a dividend return of 3.69%, resulting in a total return of 331.47%.<BR><BR>In the last 4 years, the price return was 338.99%, along with a dividend return of 8.49%, giving a total return of 347.48%.<BR><BR>Over the past 5 years, the price return was 885.01%, with a dividend return of 16.86%, leading to a total return of 901.87%.<BR><BR>Overall, Vikram Thermo has declared a dividend, and while the recent returns over shorter periods have been negative, the longer-term returns show significant growth, particularly in the 5-year period.

View full answer
iScoreScore
Click here to find our call on this stock
Strong Sell
Sell
Hold
Buy
Strong Buy

Dashboard

1

Company has a Debt to Equity ratio (avg) of 0.01 times

 
2

Positive results in Jun 26

3

With ROE of 31.9, it has a Very Expensive valuation with a 7 Price to Book Value

4

Despite the size of the company, domestic mutual funds hold only 0% of the company

5

Market Beating performance in long term as well as near term

stock-summaryMojo Parameters

Mojo Parameters

Loading Valuation Snapshot...

Stock DNA

stock-summary
Industry

Commodity Chemicals

stock-summary
Market cap

INR 960 Cr (Micro Cap)

stock-summary
P/E

22.00

stock-summary
Industry P/E

43

stock-summary
Dividend Yield

0.33%

stock-summary
Debt Equity

-0.06

stock-summary
Return on Equity

31.93%

stock-summary
Price to Book

6.98

Revenue and Profits:
Net Sales:
38 Cr
(Quarterly Results - Jun 2026)
Net Profit:
13 Cr
stock-summaryTotal Returns
Total Returns (Price + Dividend) stock-summary
Dividend Yield (0.33%)
TimePeriod
Price Return
Dividend Return
Total Return
3 Months
73.03%
0%
73.03%
6 Months
103.32%
0%
103.32%
1 Year
85.45%
0.60%
86.05%
2 Years
67.4%
0.94%
68.34%
3 Years
175.97%
1.63%
177.6%
4 Years
648.53%
3.96%
652.49%
5 Years
669.81%
6.57%
676.38%

Latest dividend: 1 per share ex-dividend date: Sep-19-2025

Risk Adjusted Returns v/s stock-summary
Returns Beta
Icon
Beta has not been calculated since enough price history is not available
stock-summaryNews & Corporate Actions

Announcements stock-summary

Announcement under Regulation 30 (LODR)-Newspaper Publication

21-Aug-2026 | Source : BSE

Please find enclosed herewith Newspaper Publication in respect to IEPF.

Announcement under Regulation 30 (LODR)-Newspaper Publication

12-Aug-2026 | Source : BSE

Enclosed herewith copy of advertisement given in newspaper of unaudited financial results for the quarter ended 30-6-2026.

COMPLIANCE OF REGULATION 33 OF SECURITIES AND EXCHANGE BOARD OF INDIA (LISTING OBLIGATIONS AND DISCLOSURES REQUIREMENTS) REGULATIONS 2015 FOR M/S. VIKRAM THERMO (INDIA) LIMITED.

11-Aug-2026 | Source : BSE

Kindly find enclosed herewith unaudited financial results for the quarter ended on 30th June 2026

Corporate Actions stock-summary

stock-summary
BOARD MEETING

No Upcoming Board Meetings

stock-summary
DIVIDEND

Vikram Thermo (India) Ltd has declared 10% dividend, ex-date: 19 Sep 25

stock-summary
SPLITS

No Splits history available

stock-summary
BONUS

Vikram Thermo (India) Ltd has announced 4:1 bonus issue, ex-date: 12 May 22

stock-summary
RIGHTS

No Rights history available

stock-summaryKey Factors

Quality key factors stock-summary

Factor
Value
Sales Growth (5y)
12.70%
EBIT Growth (5y)
32.86%
EBIT to Interest (avg)
33.67
Debt to EBITDA (avg)
0.41
Net Debt to Equity (avg)
-0.06
Sales to Capital Employed (avg)
0.98
Tax Ratio
26.32%
Dividend Payout Ratio
38.72%
Pledged Shares
0
Institutional Holding
0.26%
ROCE (avg)
27.23%
ROE (avg)
21.25%

Valuation key factors

Factor
Value
P/E Ratio
22
Industry P/E
43
Price to Book Value
6.98
EV to EBIT
16.53
EV to EBITDA
15.68
EV to Capital Employed
7.39
EV to Sales
6.58
PEG Ratio
0.63
Dividend Yield
0.33%
ROCE (Latest)
34.32%
ROE (Latest)
31.93%

Technicals key factors

Indicator
Weekly
Monthly
MACD
Bullish
Bullish
RSI
Bearish
No Signal
Bollinger Bands
Bullish
Bullish
Moving Averages
Bullish (Daily)
KST
Bullish
Bullish
Dow Theory
Bullish
Bullish
stock-summary Technical Indicator Scale: Bearish, Mildly Bearish, Sideways, Mildly Bullish, Bullish  Turned 
stock-summaryShareholding
Shareholding Snapshot : Jun 2026stock-summary
Shareholding Compare (%holding) stock-summary
Majority shareholders

Promoters

Pledged Promoter Holdings

None

Mutual Funds

Held by 0 Schemes

FIIs

Held by 0 FIIs

Promoter with highest holding

Dhirajlal Karsanbhai Patel (13.72%)

Highest Public shareholder

Basava Sankararao Kolli (2.27%)

Individual Investors Holdings

27.72%

stock-summaryFinancial
[
  {
    "link": "quarterly",
    "btn_text": "All Quarterly Results",
    "header": "Quarterly Results Snapshot (Standalone) - Jun'26 - QoQ",
    "rhs": [
      {
        "prefix": "Net Sales ",
        "suffix": "QoQ Growth in quarter ended Jun 2026 is 0.26% vs 11.02% in Mar 2026",
        "dir": -1
      },
      {
        "prefix": "Standalone Net Profit ",
        "suffix": "QoQ Growth in quarter ended Jun 2026 is 55.87% vs -22.26% in Mar 2026",
        "dir": 1
      }
    ],
    "table": {
      "header": [
        "Jun'26",
        "Mar'26",
        "Change(%)"
      ],
      "body": [
        {
          "field": "Net Sales",
          "val1": "37.87",
          "val2": "37.77",
          "chgp": "0.26%",
          "chgp_class": "positive"
        },
        {
          "field": "Operating Profit (PBDIT) excl Other Income",
          "val1": "18.01",
          "val2": "11.96",
          "chgp": "50.59%",
          "chgp_class": "positive"
        },
        {
          "field": "Interest",
          "val1": "0.12",
          "val2": "0.11",
          "chgp": "9.09%",
          "chgp_class": "negative"
        },
        {
          "field": "Exceptional Items",
          "val1": "0.00",
          "val2": "0.00",
          "chgp": "",
          "chgp_class": "neutral"
        },
        {
          "field": "Standalone Net Profit",
          "val1": "13.28",
          "val2": "8.52",
          "chgp": "55.87%",
          "chgp_class": "positive"
        },
        {
          "field": "Operating Profit Margin (Excl OI)",
          "val1": "47.56%",
          "val2": "31.67%",
          "chgp": "15.89%",
          "chgp_class": "positive"
        }
      ]
    }
  },
  {
    "link": "half-yearly",
    "btn_text": "All Half Yearly Results",
    "header": "Half Yearly Results Snapshot (Standalone) - Sep'25",
    "rhs": [
      {
        "prefix": "Net Sales ",
        "suffix": " Growth in half year ended Sep 2025 is -2.41% vs 2.24% in Sep 2024",
        "dir": -1
      },
      {
        "prefix": "Standalone Net Profit ",
        "suffix": " Growth in half year ended Sep 2025 is 414.38% vs -143.18% in Sep 2024",
        "dir": 1
      }
    ],
    "table": {
      "header": [
        "Sep'25",
        "Sep'24",
        "Change(%)"
      ],
      "body": [
        {
          "field": "Net Sales",
          "val1": "63.24",
          "val2": "64.80",
          "chgp": "-2.41%",
          "chgp_class": "negative"
        },
        {
          "field": "Operating Profit (PBDIT) excl Other Income",
          "val1": "26.81",
          "val2": "24.11",
          "chgp": "11.20%",
          "chgp_class": "positive"
        },
        {
          "field": "Interest",
          "val1": "0.21",
          "val2": "0.37",
          "chgp": "-43.24%",
          "chgp_class": "positive"
        },
        {
          "field": "Exceptional Items",
          "val1": "0.00",
          "val2": "-25.66",
          "chgp": "100.00%",
          "chgp_class": "positive"
        },
        {
          "field": "Standalone Net Profit",
          "val1": "19.02",
          "val2": "-6.05",
          "chgp": "414.38%",
          "chgp_class": "positive"
        },
        {
          "field": "Operating Profit Margin (Excl OI)",
          "val1": "42.39%",
          "val2": "37.21%",
          "chgp": "5.18%",
          "chgp_class": "positive"
        }
      ]
    }
  },
  {
    "link": "nine-monthly",
    "btn_text": "All Nine Monthly Results",
    "header": "Nine Monthly Results Snapshot (Standalone) - Dec'25",
    "rhs": [
      {
        "prefix": "Net Sales ",
        "suffix": "YoY Growth in nine months ended Dec 2025 is -1.88% vs 12.98% in Dec 2024",
        "dir": -1
      },
      {
        "prefix": "Standalone Net Profit ",
        "suffix": "YoY Growth in nine months ended Dec 2025 is 909.43% vs -85.48% in Dec 2024",
        "dir": 1
      }
    ],
    "table": {
      "header": [
        "Dec'25",
        "Dec'24",
        "Change(%)"
      ],
      "body": [
        {
          "field": "Net Sales",
          "val1": "97.26",
          "val2": "99.12",
          "chgp": "-1.88%",
          "chgp_class": "negative"
        },
        {
          "field": "Operating Profit (PBDIT) excl Other Income",
          "val1": "41.95",
          "val2": "37.45",
          "chgp": "12.02%",
          "chgp_class": "positive"
        },
        {
          "field": "Interest",
          "val1": "0.34",
          "val2": "0.79",
          "chgp": "-56.96%",
          "chgp_class": "positive"
        },
        {
          "field": "Exceptional Items",
          "val1": "0.00",
          "val2": "-26.71",
          "chgp": "100.00%",
          "chgp_class": "positive"
        },
        {
          "field": "Standalone Net Profit",
          "val1": "29.98",
          "val2": "2.97",
          "chgp": "909.43%",
          "chgp_class": "positive"
        },
        {
          "field": "Operating Profit Margin (Excl OI)",
          "val1": "43.13%",
          "val2": "37.78%",
          "chgp": "5.35%",
          "chgp_class": "positive"
        }
      ]
    }
  },
  {
    "link": "annual",
    "btn_text": "All Annual Results",
    "header": "Annual Results Snapshot (Standalone) - Mar'26",
    "rhs": [
      {
        "prefix": "Net Sales ",
        "suffix": "YoY Growth in year ended Mar 2026 is 6.23% vs 24.65% in Mar 2025",
        "dir": -1
      },
      {
        "prefix": "Standalone Net Profit ",
        "suffix": "YoY Growth in year ended Mar 2026 is 375.31% vs -68.09% in Mar 2025",
        "dir": 1
      }
    ],
    "table": {
      "header": [
        "Mar'26",
        "Mar'25",
        "Change(%)"
      ],
      "body": [
        {
          "field": "Net Sales",
          "val1": "134.10",
          "val2": "126.23",
          "chgp": "6.23%",
          "chgp_class": "positive"
        },
        {
          "field": "Operating Profit (PBDIT) excl Other Income",
          "val1": "54.05",
          "val2": "44.69",
          "chgp": "20.94%",
          "chgp_class": "positive"
        },
        {
          "field": "Interest",
          "val1": "0.46",
          "val2": "0.94",
          "chgp": "-51.06%",
          "chgp_class": "positive"
        },
        {
          "field": "Exceptional Items",
          "val1": "0.00",
          "val2": "-25.66",
          "chgp": "100.00%",
          "chgp_class": "positive"
        },
        {
          "field": "Standalone Net Profit",
          "val1": "38.50",
          "val2": "8.10",
          "chgp": "375.31%",
          "chgp_class": "positive"
        },
        {
          "field": "Operating Profit Margin (Excl OI)",
          "val1": "40.31%",
          "val2": "35.40%",
          "chgp": "4.91%",
          "chgp_class": "positive"
        }
      ]
    }
  }
]

Quarterly Results Snapshot (Standalone) - Jun'26 - QoQstock-summary

Jun'26
Mar'26
Change(%)
Net Sales
37.87
37.77
0.26%
Operating Profit (PBDIT) excl Other Income
18.01
11.96
50.59%
Interest
0.12
0.11
9.09%
Exceptional Items
0.00
0.00
Standalone Net Profit
13.28
8.52
55.87%
Operating Profit Margin (Excl OI)
47.56%
31.67%
15.89%
Values in Rs Cr.
Direction Arrows
Net Sales

QoQ Growth in quarter ended Jun 2026 is 0.26% vs 11.02% in Mar 2026

Direction Arrows
Standalone Net Profit

QoQ Growth in quarter ended Jun 2026 is 55.87% vs -22.26% in Mar 2026

Half Yearly Results Snapshot (Standalone) - Sep'25stock-summary

Sep'25
Sep'24
Change(%)
Net Sales
63.24
64.80
-2.41%
Operating Profit (PBDIT) excl Other Income
26.81
24.11
11.20%
Interest
0.21
0.37
-43.24%
Exceptional Items
0.00
-25.66
100.00%
Standalone Net Profit
19.02
-6.05
414.38%
Operating Profit Margin (Excl OI)
42.39%
37.21%
5.18%
Values in Rs Cr.
Direction Arrows
Net Sales

Growth in half year ended Sep 2025 is -2.41% vs 2.24% in Sep 2024

Direction Arrows
Standalone Net Profit

Growth in half year ended Sep 2025 is 414.38% vs -143.18% in Sep 2024

Nine Monthly Results Snapshot (Standalone) - Dec'25stock-summary

Dec'25
Dec'24
Change(%)
Net Sales
97.26
99.12
-1.88%
Operating Profit (PBDIT) excl Other Income
41.95
37.45
12.02%
Interest
0.34
0.79
-56.96%
Exceptional Items
0.00
-26.71
100.00%
Standalone Net Profit
29.98
2.97
909.43%
Operating Profit Margin (Excl OI)
43.13%
37.78%
5.35%
Values in Rs Cr.
Direction Arrows
Net Sales

YoY Growth in nine months ended Dec 2025 is -1.88% vs 12.98% in Dec 2024

Direction Arrows
Standalone Net Profit

YoY Growth in nine months ended Dec 2025 is 909.43% vs -85.48% in Dec 2024

Annual Results Snapshot (Standalone) - Mar'26stock-summary

Mar'26
Mar'25
Change(%)
Net Sales
134.10
126.23
6.23%
Operating Profit (PBDIT) excl Other Income
54.05
44.69
20.94%
Interest
0.46
0.94
-51.06%
Exceptional Items
0.00
-25.66
100.00%
Standalone Net Profit
38.50
8.10
375.31%
Operating Profit Margin (Excl OI)
40.31%
35.40%
4.91%
Values in Rs Cr.
Direction Arrows
Net Sales

YoY Growth in year ended Mar 2026 is 6.23% vs 24.65% in Mar 2025

Direction Arrows
Standalone Net Profit

YoY Growth in year ended Mar 2026 is 375.31% vs -68.09% in Mar 2025

stock-summaryCompany CV
About Vikram Thermo (India) Ltd stock-summary
stock-summary
Vikram Thermo (India) Ltd
Micro Cap
Commodity Chemicals
Vikram Thermo (India) Limited is one of the fastest growing Pharmaceutical company. The Company is a manufacturer, marketer & exporter of various pharmaceutical excipients, who provides complete solution in Film Coating / Enteric coating & Sustain Release / Control Release formulations to pharma industry. Its prestigious brand 'Drugcoat' is one of the common name in many pharmaceutical industries.
Company Coordinates stock-summary
Company Details
A/704-714 The Capital, Science City Road Ahmedabad Gujarat : 380060
stock-summary
Tel:
stock-summary
exports@vikramthermo.com
Registrar Details
Bigshare Services Pvt Ltd , E-2 , Ansa Industrial Estate, Saki Vihar Road, Saki Naka, Andheri (E), Mumbai