
Compare Vikran Engg. with Similar Stocks
Dashboard
Strong ability to service debt as the company has a low Debt to EBITDA ratio of 1.69 times
With a growth in Net Profit of 167.81%, the company declared Very Positive results in Mar 26
With ROCE of 25.5, it has a Very Attractive valuation with a 3.1 Enterprise value to Capital Employed
Falling Participation by Institutional Investors
Stock DNA
Heavy Electrical Equipment
INR 1,828 Cr (Small Cap)
20.00
58
0.00%
0.44
19.80%
3.96
Total Returns (Price + Dividend) 
Vikran Engg. for the last several years.
Risk Adjusted Returns v/s
Returns Beta

News

Vikran Engineering Ltd Technical Momentum Shifts to Mildly Bullish Amid Market Challenges
Vikran Engineering Ltd, a small-cap player in the Heavy Electrical Equipment sector, has experienced a notable shift in its technical momentum, moving from a mildly bearish to a mildly bullish stance. Despite recent price gains and positive weekly technical indicators, the stock’s year-to-date returns lag behind the broader Sensex, prompting a cautious outlook from analysts.
Read full news article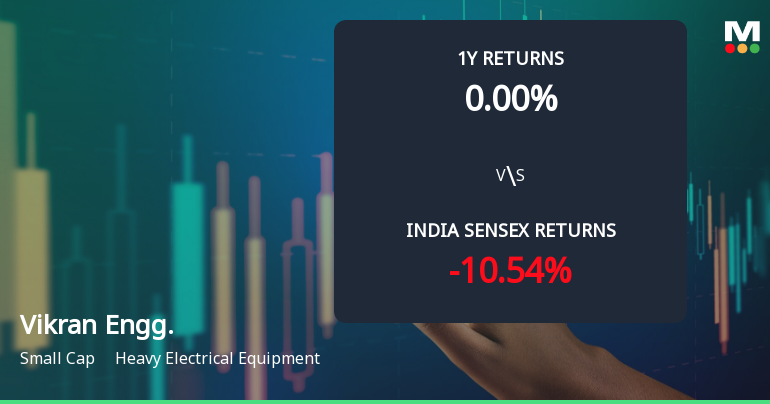
Vikran Engineering Ltd Faces Technical Momentum Shift Amid Bearish Signals
Vikran Engineering Ltd, a small-cap player in the Heavy Electrical Equipment sector, has experienced a notable shift in its technical momentum, moving from a mildly bullish to a mildly bearish trend. This change is underscored by mixed signals from key technical indicators such as MACD, RSI, Bollinger Bands, and moving averages, reflecting growing caution among investors amid a challenging market backdrop.
Read full news article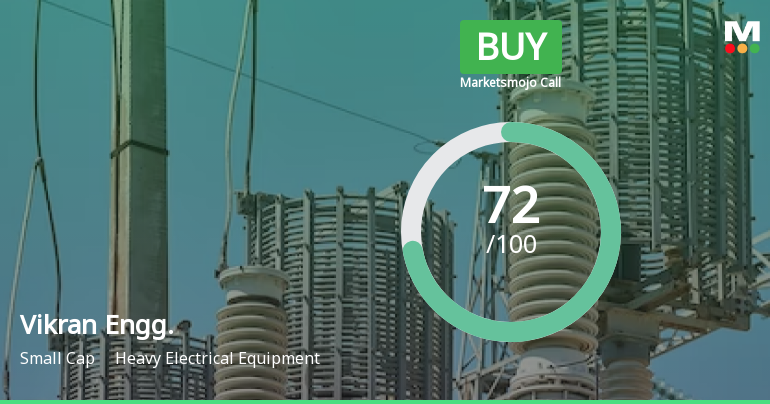
Vikran Engineering Ltd is Rated Buy by MarketsMOJO
Vikran Engineering Ltd is rated Buy by MarketsMOJO, with this rating last updated on 25 May 2026. However, the analysis and financial metrics discussed here reflect the company’s current position as of 06 June 2026, providing investors with the most up-to-date insight into the stock’s fundamentals, valuation, financial trends, and technical outlook.
Read full news article Announcements
Announcement under Regulation 30 (LODR)-Allotment
05-Jun-2026 | Source : BSEAllotment of 20 (Twenty) Secured unlisted Redeemable Non Convertible Debentures of the face value of INR 5000000/- (Indian Rupees Fifty Lakhs Only) each and aggregating to INR 100000000/-(Indian Rupees Ten Crores Only) on private placement basis.
Announcement under Regulation 30 (LODR)-Analyst / Investor Meet - Intimation
03-Jun-2026 | Source : BSEwe wish to inform that the management of the Company will meet with Analysts/Investors on Monday 08th June 2026
Announcement under Regulation 30 (LODR)-Earnings Call Transcript
01-Jun-2026 | Source : BSETranscript of the Q4 and FY26 Earnings Conference Call
Corporate Actions

No Upcoming Board Meetings

No Dividend history available

No Splits history available

No Bonus history available

No Rights history available
Quality key factors
Valuation key factors
Technicals key factors
 Technical Indicator Scale: Bearish, Mildly Bearish, Sideways, Mildly Bullish, Bullish Turned
 Shareholding Snapshot : Mar 2026
Shareholding Compare (%holding)
Promoters
None
Held by 0 Schemes
Held by 6 FIIs (1.11%)
Rakesh Markhedkar (40.06%)
India Inflection Opportunity Trust-india Inflection Opportunity Fund (3.85%)
30.82%
Quarterly Results Snapshot (Standalone) - Mar'26 - QoQ

QoQ Growth in quarter ended Mar 2026 is 142.96% vs 51.15% in Dec 2025
QoQ Growth in quarter ended Mar 2026 is 167.81% vs 128.77% in Dec 2025
Half Yearly Results Snapshot (Standalone) - Sep'25
Not Applicable: The company has declared_date for only one period
Not Applicable: The company has declared_date for only one period
Nine Monthly Results Snapshot (Standalone) - Dec'25
Not Applicable: The company has declared_date for only one period
Not Applicable: The company has declared_date for only one period
Annual Results Snapshot (Standalone) - Mar'26
Not Applicable: The company has declared_date for only one period
Not Applicable: The company has declared_date for only one period
About Vikran Engineering Ltd

Company Coordinates


