
Compare Vinyl Chemicals with Similar Stocks
Dashboard
High Management Efficiency with a high ROE of 23.35%
The company is Net-Debt Free
Poor long term growth as Operating profit has grown by an annual rate -3.95% of over the last 5 years
The company has declared Negative results for the last 4 consecutive quarters
With ROE of 12.7, it has a Expensive valuation with a 3.4 Price to Book Value
Majority shareholders : Promoters
Consistent Underperformance against the benchmark over the last 3 years
Total Returns (Price + Dividend) 
Latest dividend: 7 per share ex-dividend date: May-22-2026
Risk Adjusted Returns v/s
Returns Beta

News
Vinyl Chemicals (I) Ltd Upgraded to Hold as Technicals Improve Amid Mixed Financials
Vinyl Chemicals (I) Ltd has seen its investment rating upgraded from Sell to Hold as of 11 June 2026, driven primarily by a shift in technical indicators despite ongoing challenges in financial performance. The company’s Mojo Score rose to 51.0, reflecting a more balanced outlook amid mixed signals from valuation, quality, financial trends, and technical analysis.
Read full news article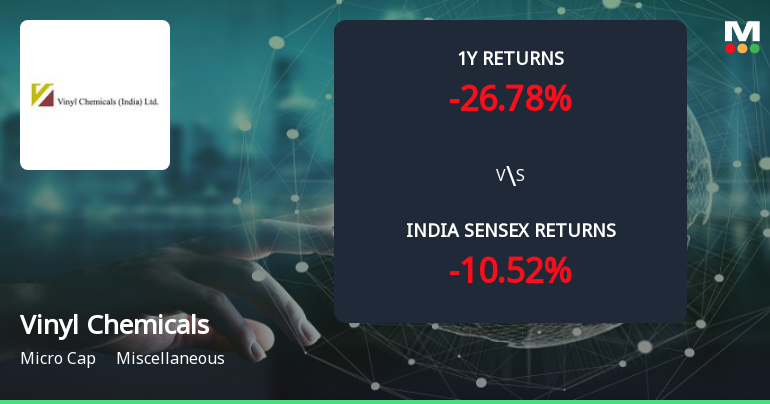
Golden Cross Forms in Vinyl Chemicals (I) Ltd — On a Day the Stock Fell 0.91%. What the Mixed Signals Mean
The 50-day moving average has crossed above the 200-day moving average for Vinyl Chemicals (I) Ltd, signalling a golden cross on 11 Jun 2026. However, the stock declined 0.91% on the day this technical event occurred, and the monthly indicators present a mixed picture. This divergence between the moving averages and price action calls for a detailed examination of the signal’s reliability.
Read full news article
Vinyl Chemicals (I) Ltd is Rated Sell
Vinyl Chemicals (I) Ltd is rated Sell by MarketsMOJO, with this rating last updated on 25 May 2026. However, the analysis and financial metrics discussed here reflect the stock’s current position as of 10 June 2026, providing investors with an up-to-date view of the company’s fundamentals, returns, and market standing.
Read full news article Announcements
Shareholder Meeting / Postal Ballot-Scrutinizers Report
05-Jun-2026 | Source : BSEAs enclosed
Shareholder Meeting / Postal Ballot-Outcome of AGM
05-Jun-2026 | Source : BSEAs enclosed
Announcement under Regulation 30 (LODR)-Newspaper Publication
01-Jun-2026 | Source : BSEAs enclosed
Corporate Actions

No Upcoming Board Meetings

Vinyl Chemicals (I) Ltd has declared 700% dividend, ex-date: 22 May 26

No Splits history available

No Bonus history available

No Rights history available
Quality key factors
Valuation key factors
Technicals key factors
 Technical Indicator Scale: Bearish, Mildly Bearish, Sideways, Mildly Bullish, Bullish Turned
 Shareholding Snapshot : Mar 2026
Shareholding Compare (%holding)
Promoters
None
Held by 1 Schemes (0.0%)
Held by 1 FIIs (0.02%)
Pidilite Industries Limited (40.64%)
None
40.66%
Quarterly Results Snapshot (Standalone) - Mar'26 - QoQ

QoQ Growth in quarter ended Mar 2026 is 6.11% vs 11.58% in Dec 2025
QoQ Growth in quarter ended Mar 2026 is 2.88% vs 56.94% in Dec 2025
Half Yearly Results Snapshot (Standalone) - Sep'25
Growth in half year ended Sep 2025 is -0.93% vs 13.44% in Sep 2024
Growth in half year ended Sep 2025 is -27.06% vs 36.18% in Sep 2024
Nine Monthly Results Snapshot (Standalone) - Dec'25
YoY Growth in nine months ended Dec 2025 is 4.47% vs 5.51% in Dec 2024
YoY Growth in nine months ended Dec 2025 is -21.31% vs 5.24% in Dec 2024
Annual Results Snapshot (Standalone) - Mar'26
YoY Growth in year ended Mar 2026 is 4.35% vs 4.73% in Mar 2025
YoY Growth in year ended Mar 2026 is -26.11% vs 2.24% in Mar 2025
About Vinyl Chemicals (I) Ltd

Company Coordinates


