
Compare Vinyoflex with Similar Stocks
Stock DNA
Commodity Chemicals
INR 23 Cr (Micro Cap)
7.00
36
0.00%
-0.17
9.19%
0.65
Total Returns (Price + Dividend) 
Vinyoflex for the last several years.
Risk Adjusted Returns v/s
Returns Beta

News
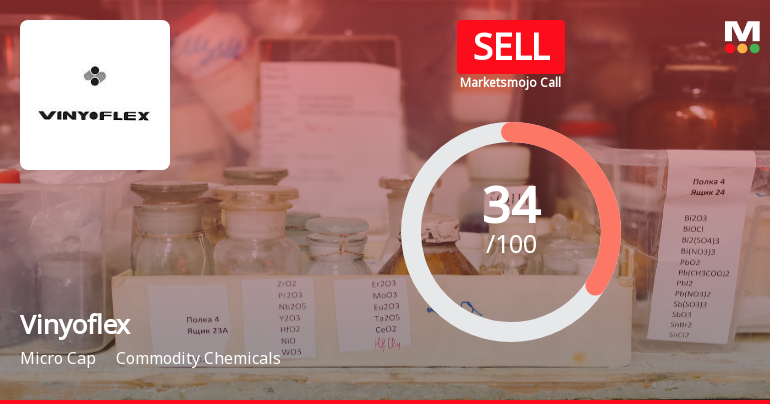
Vinyoflex Ltd Upgraded to Sell from Strong Sell Amid Mixed Technical and Financial Signals
Vinyoflex Ltd, a micro-cap player in the commodity chemicals sector, has seen its investment rating upgraded from Strong Sell to Sell as of 22 June 2026. This change is primarily driven by a shift in technical indicators, even as the company continues to grapple with weak long-term fundamentals and underperformance against benchmarks. The nuanced upgrade reflects a complex interplay of quality, valuation, financial trends, and technical signals that investors should carefully consider.
Read full news article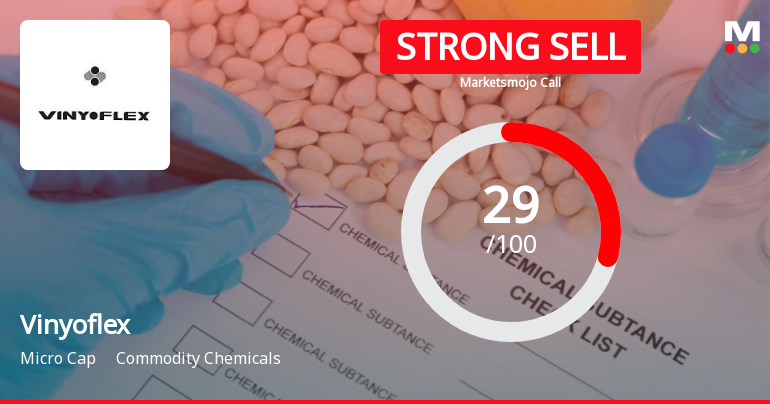
Vinyoflex Ltd Downgraded to Strong Sell Amid Technical Weakness and Long-Term Underperformance
Vinyoflex Ltd, a micro-cap player in the commodity chemicals sector, has seen its investment rating downgraded from Sell to Strong Sell as of 15 June 2026. This shift reflects a deterioration across key parameters including technical indicators, valuation metrics, financial trends, and overall quality scores, signalling heightened caution for investors amid ongoing underperformance and bearish market signals.
Read full news articleAre Vinyoflex Ltd latest results good or bad?
Vinyoflex Ltd's latest quarterly results for Q4 FY25 reflect a notable performance, with net sales reaching ₹11.80 crores, which represents a year-on-year growth of 9.97% compared to ₹10.73 crores in Q4 FY24. This quarter also marked a significant increase in net profit, which stood at ₹1.08 crores, reflecting a substantial year-on-year growth of 145.45% from ₹0.44 crores in the same quarter last year. The operating profit, excluding other income, was reported at ₹1.47 crores, yielding an operating margin of 12.46%. This margin indicates a year-on-year improvement from 5.03% in Q4 FY24, although it slightly contracted from 12.87% in the previous quarter. The company's ability to maintain margins above 12% suggests enhanced cost management and possibly better pricing power in its market. Despite these positive quarterly results, Vinyoflex's overall performance over the past few years has been characterize...
Read full news article Announcements
Closure of Trading Window
27-Jun-2026 | Source : BSEClosure of Trading Window
Announcement under Regulation 30 (LODR)-Newspaper Publication
28-May-2026 | Source : BSEAnnouncement under Regulation 30 (LODR)- Newspaper Publication
Compliances-Reg.24(A)-Annual Secretarial Compliance
28-May-2026 | Source : BSEAnnual Secretarial Compliance Report for the period of March 2026 is attached herewith.
Corporate Actions

No Upcoming Board Meetings

No Dividend history available

No Splits history available

No Bonus history available

No Rights history available
Quality key factors
Valuation key factors
Technicals key factors
 Technical Indicator Scale: Bearish, Mildly Bearish, Sideways, Mildly Bullish, Bullish Turned
 Shareholding Snapshot : Mar 2026
Shareholding Compare (%holding)
Promoters
None
Held by 0 Schemes
Held by 0 FIIs
Vinodkumar K Tilva (4.72%)
Sangeetha S (3.47%)
42.76%
Quarterly Results Snapshot (Standalone) - Mar'26 - YoY

YoY Growth in quarter ended Mar 2026 is 9.97% vs -8.45% in Mar 2025
YoY Growth in quarter ended Mar 2026 is 145.45% vs -55.56% in Mar 2025
Half Yearly Results Snapshot (Standalone) - Sep'25
Growth in half year ended Sep 2025 is -0.11% vs -7.31% in Sep 2024
Growth in half year ended Sep 2025 is 18.45% vs -32.24% in Sep 2024
Nine Monthly Results Snapshot (Standalone) - Dec'25

YoY Growth in nine months ended Dec 2025 is -8.55% vs -8.31% in Dec 2024
YoY Growth in nine months ended Dec 2025 is -0.93% vs -20.37% in Dec 2024
Annual Results Snapshot (Standalone) - Mar'26
YoY Growth in year ended Mar 2026 is -3.83% vs -8.37% in Mar 2025
YoY Growth in year ended Mar 2026 is 24.42% vs -29.89% in Mar 2025
About Vinyoflex Ltd

Company Coordinates


