
Compare Vipul Ltd with Similar Stocks
Dashboard
Weak Long Term Fundamental Strength as the company has not declared results in the last 6 months
- Poor long term growth as Net Sales has grown by an annual rate of 8.42% and Operating profit at 6.59% over the last 5 years
- Low ability to service debt as the company has a high Debt to EBITDA ratio of -2.23 times
The company has declared Negative results for the last 5 consecutive quarters
Risky - Negative EBITDA
30.71% of Promoter Shares are Pledged
Stock DNA
Realty
INR 223 Cr (Micro Cap)
NA (Loss Making)
37
0.00%
0.10
-7.63%
0.57
Total Returns (Price + Dividend) 
Latest dividend: 0.05 per share ex-dividend date: Sep-12-2019
Risk Adjusted Returns v/s
Returns Beta

News

Vipul Ltd Locks at Lower Circuit With 4.98% Loss — Sellers Queue, No Buyers in Sight
At Rs 15.64, sellers were still queuing — but there were no buyers willing to take the other side. Vipul Ltd locked at its lower circuit of 4.98% on 17 Jul 2026, with unfilled sell orders and a frozen price, reflecting persistent selling pressure in a micro-cap stock with limited liquidity.
Read full news article
Vipul Ltd Locks at Lower Circuit With 4.97% Loss — Sellers Queue, No Buyers in Sight
At Rs 16.46, Vipul Ltd locked at its lower circuit on 16 Jul 2026, reflecting a 4.97% decline within a 5% price band. Sellers were lined up to exit, but the absence of buyers froze the price, creating unfilled supply and a trading halt at the floor price.
Read full news article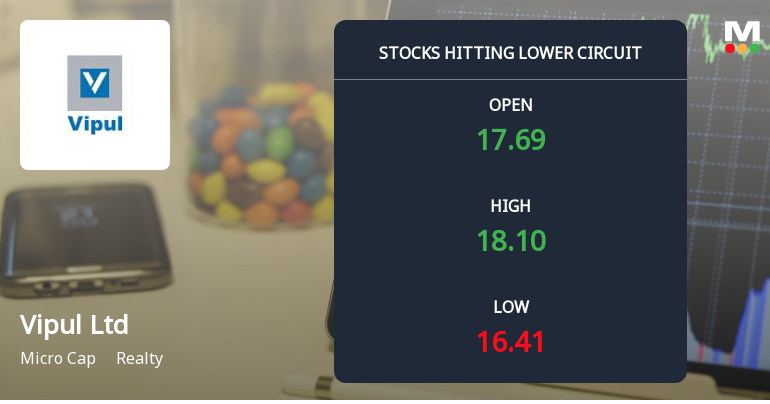
Vipul Ltd Locks at Lower Circuit With 5% Loss — Sellers Queue, No Buyers in Sight
At Rs 16.82, Vipul Ltd locked at its lower circuit limit of 5% on 15 Jul 2026, with persistent unfilled supply as sellers queued but buyers remained absent. The price band capped the daily loss, freezing trade at the floor price and highlighting the liquidity challenges faced by this micro-cap realty stock.
Read full news article Announcements
Vipul Limited - Clarification
18-Nov-2019 | Source : NSEVipul Limited has informed the Exchange regarding clarification on Merger of five wholly owned subsidiary companies of Vipul Limited along with the Company.
Vipul Limited - Updates
15-Nov-2019 | Source : NSEVipul Limited has informed the Exchange regarding 'Newspaper Advertisement of Unaudited Financial Results for the Second Quarter and Half Year Ended on September 30, 2019 (Standalone and Consolidated) '.
Vipul Limited - Outcome of Board Meeting
14-Nov-2019 | Source : NSEVipul Limited has informed the Exchange regarding Board meeting held on November 13, 2019.
Corporate Actions

No Upcoming Board Meetings

Vipul Ltd has declared 5% dividend, ex-date: 12 Sep 19

Vipul Ltd has announced 1:2 stock split, ex-date: 04 May 10

Vipul Ltd has announced 1:1 bonus issue, ex-date: 08 Mar 07

No Rights history available
Quality key factors
Valuation key factors
Technicals key factors
 Technical Indicator Scale: Bearish, Mildly Bearish, Sideways, Mildly Bullish, Bullish Turned
 Shareholding Snapshot : Mar 2026
Shareholding Compare (%holding)
Non Institution
30.7134
Held by 0 Schemes
Held by 7 FIIs (13.21%)
Punit Beriwala Huf (6.98%)
Moneyplant Gold & Jewellery Trading L.l.c (6.59%)
43.71%
Quarterly Results Snapshot (Consolidated) - Dec'25 - QoQ

QoQ Growth in quarter ended Dec 2025 is 15.60% vs 370.41% in Sep 2025
QoQ Growth in quarter ended Dec 2025 is -83.29% vs 609.86% in Sep 2025
Half Yearly Results Snapshot (Consolidated) - Sep'25
Growth in half year ended Sep 2025 is -69.46% vs 132.40% in Sep 2024
Growth in half year ended Sep 2025 is 97.29% vs 109.11% in Sep 2024
Nine Monthly Results Snapshot (Consolidated) - Dec'25

YoY Growth in nine months ended Dec 2025 is -56.03% vs -74.92% in Dec 2024
YoY Growth in nine months ended Dec 2025 is 5.24% vs -78.30% in Dec 2024
Annual Results Snapshot (Consolidated) - Mar'25
YoY Growth in year ended Mar 2025 is -57.83% vs 175.61% in Mar 2024
YoY Growth in year ended Mar 2025 is -112.11% vs 298.99% in Mar 2024
About Vipul Ltd

Company Coordinates


