Virat Industries

  • Market Cap: Micro Cap
  • Industry: Garments & Apparels
  • ISIN: INE467D01017
  • NSEID: VIRAT
  • BSEID: 530521
INR
421.60
0.00 (0.00%)
BSENSE

Sep 15, 03:30 PM

BSE+NSE Vol: 41

  • Price Points
  • Score
  • Mojo Parameters
  • Total Return
  • News and Corporate Actions
  • Key factors
  • Shareholding
  • Financials
  • CompanyCV
stock-summaryPrice Point
High/Low

1Day

52 Week

Valuation
Technical
Day's Volume

CASH

41 (-99.28%) Volume

Shareholding (Jun 2026)

FII

0.00%

Held by 0 FIIs

DII

0.00%

Held by 0 DIIs

Promoter

74.55%

Why is Virat Industries Ltd falling/rising?

06-Sep-2026

As of 05-Sep, Virat Industries Ltd's stock price is declining, currently at 421.95, down 1.38%. The stock has underperformed the Sensex by 9.14% over the past week, with a significant drop in trading volume and a bearish trend indicated by its moving averages.

As of 05-Sep, Virat Industries Ltd is experiencing a decline in its stock price, currently at 421.95, which represents a decrease of 5.9 points or 1.38%. This downward trend is reflected in the stock's performance over the past week, where it has underperformed the benchmark Sensex by 9.14%, and has seen a significant drop of 8.91% over the last five days. <BR><BR>The stock has also touched an intraday low of Rs 412.55, indicating a loss of 3.58% during the trading day. Additionally, the stock's delivery volume has decreased sharply, falling by 70.26% compared to the five-day average, suggesting a decline in investor participation. Although the stock is trading above its 20-day and 50-day moving averages, it remains below its 5-day, 100-day, and 200-day moving averages, which may indicate a bearish trend.<BR><BR>Overall, the combination of consecutive price falls, reduced trading volume, and underperformance relative to the sector contributes to the current decline in Virat Industries Ltd's stock price.

View full answer

Who are in the management team of Virat Industries?

01-Sep-2026

The management team of Virat Industries includes Adi F Madan (Managing Director), Ayesha K Dadyburjor (Whole-time Director), and four Independent Directors: Ajit P Walwaikar, Harish H Shah, Pheroze A Dhanbhoora, along with Non-Executive Director Kaizad Dady Burjor.

The management team of Virat Industries includes the following individuals:<BR><BR>1. **Adi F Madan** - Managing Director<BR>2. **Ajit P Walwaikar** - Independent Director<BR>3. **Harish H Shah** - Independent Director<BR>4. **Ayesha K Dadyburjor** - Whole-time Director<BR>5. **Kaizad Dady Burjor** - Non Executive Director<BR>6. **Pheroze A Dhanbhoora** - Independent Director<BR><BR>If you need more information about their roles or the company, feel free to ask!

View full answer

What does Virat Industries do?

01-Sep-2026

Virat Industries Ltd is a micro-cap company in the Garments & Apparels industry, specializing in manufacturing high-quality socks for export to European markets. Established in 1990, it reported net sales of 9 Cr and a net profit of 2 Cr for June 2026.

Overview: <BR>Virat Industries Ltd is a micro-cap company in the Garments & Apparels industry that specializes in manufacturing high-quality socks primarily for export to European markets.<BR><BR>History: <BR>Virat Industries Ltd was established in 1990 and commenced operations in 1995. The latest quarterly results reported are for June 2026, showing a decade of experience in the socks business.<BR><BR>Financial Snapshot: <BR>Net Sales: 9 Cr (Quarterly Results - Jun 2026) <BR>Net Profit: 2 Cr (Quarterly Results - Jun 2026) <BR>Market-cap: INR 671 Cr (Micro Cap) <BR><BR>Key Metrics: <BR>P/E: 106.00 <BR>Industry P/E: 28 <BR>Dividend Yield: 0.00% <BR>Debt Equity: -0.88 <BR>Return on Equity: 4.73% <BR>Price to Book: 5.11 <BR><BR>Contact Details: <BR>Address: A-1/2 GIDC Indl Estate, Kabilpore Navasari Navsari Gujarat : 396424 <BR>Tel: 91-2637-265011/265022 <BR>Email: factory@viratindustries.com <BR>Website: http://www.viratindustries.com

View full answer

Who are the peers of the Virat Industries?

01-Sep-2026

Virat Industries' peers include Sarla Performanc, True Green, Rajapalayam Mill, Voith Paper, Sutlej Textiles, Nahar Indl. Ent., Orbit Exports, Bizotic Commer., Karnika Industri, and Foce India. Virat Industries shows below-average management and growth ratings, with a 1-year return of -43.54%, significantly underperforming compared to its peers.

Peers: The peers of Virat Industries are Sarla Performanc, True Green, Rajapalayam Mill, Voith Paper, Sutlej Textiles, Nahar Indl. Ent., Orbit Exports, Bizotic Commer., Karnika Industri, and Foce India.<BR><BR>Quality Snapshot: Excellent management risk is observed at Orbit Exports, while Average management risk is found at Sarla Performanc, Voith Paper, Sutlej Textiles, Bizotic Commer., Karnika Industri, and Foce India. Below Average management risk is noted at True Green, Rajapalayam Mill, Virat Industries, Nahar Indl. Ent. The growth rating shows Excellent growth at Bizotic Commer., Good growth at True Green, Rajapalayam Mill, Karnika Industri, and Orbit Exports, while Below Average growth is seen at Sarla Performanc, Virat Industries, Voith Paper, Sutlej Textiles, Nahar Indl. Ent. The Capital Structure is Excellent at Voith Paper, Good at Sarla Performanc, Bizotic Commer., and Virat Industries, while Below Average is noted at True Green, Rajapalayam Mill, Sutlej Textiles, Nahar Indl. Ent.<BR><BR>Return Snapshot: True Green has the highest 1-year return at 296.24%, while Virat Industries has the lowest at -43.54%. This indicates that Virat Industries' performance is significantly worse compared to its peers. Additionally, Voith Paper, Bizotic Commer., and Karnika Industri have negative six-month returns.

View full answer

How big is Virat Industries?

01-Sep-2026

As of 31st August, Virat Industries Ltd has a market capitalization of 671.00 Cr, with net sales of 27.65 Cr and net profit of 6.18 Cr over the last four quarters.

As of 31st August, <BR><BR>Market Cap: Virat Industries Ltd has a market capitalization of 671.00 Cr, categorizing it as a Micro Cap company.<BR><BR>Recent Quarterly Performance: The sum of Net Sales for the latest 4 quarters is 27.65 Cr, while the sum of Net Profit for the same period is 6.18 Cr.<BR><BR>Balance Sheet Snapshot: The reporting period is March 2026, with Shareholder's Funds amounting to 130.74 Cr and Total Assets valued at 134.24 Cr.

View full answer

Should I buy, sell or hold Virat Industries Ltd?

16-Aug-2026

When is the next results date for Virat Industries Ltd?

05-Aug-2026

The next results date for Virat Industries Ltd is 13 August 2026.

The next results date for Virat Industries Ltd is scheduled for 13 August 2026.

View full answer

Are Virat Industries Ltd latest results good or bad?

27-May-2026

Virat Industries Ltd's latest results are unfavorable, showing a net profit of ₹1.05 crores with a significant year-on-year increase but an 11.02% decline from the previous quarter. Revenue dropped 34.02% year-on-year and operating margins turned negative at -7.06%, indicating operational challenges and reliance on non-operating income.

The latest results for Virat Industries Ltd indicate a challenging situation for the company. In Q4 FY26, the net profit was reported at ₹1.05 crores, which, while showing a significant year-on-year increase of 483.33%, reflects a decline of 11.02% compared to the previous quarter. This suggests that the company's profitability is under pressure.<BR><BR>Revenue for the same quarter was ₹5.10 crores, marking a substantial drop of 34.02% year-on-year and a 12.82% decrease from the previous quarter. This decline represents the lowest quarterly revenue in at least two years, raising concerns about the sustainability of the business.<BR><BR>Moreover, the operating margin turned negative at -7.06%, indicating that the core operations are currently unprofitable. This is a significant deterioration from previous quarters, where the company had managed to maintain positive margins. The reliance on non-operating income has become increasingly evident, as it constituted a large portion of the profit before tax, highlighting the fragility of the core business.<BR><BR>Overall, while the year-on-year profit growth may seem positive at first glance, the underlying operational challenges, revenue decline, and negative operating margins suggest that the latest results are more indicative of distress rather than strength. Therefore, the assessment of the latest results would lean towards being unfavorable.

View full answer

How has been the historical performance of Virat Industries?

15-Nov-2025

Virat Industries has experienced fluctuating financial performance, with net sales and profits declining from March 2023 to March 2025, while total assets increased. Operating profit fell significantly, but cash flow from operating activities improved in March 2024.

Answer:<BR>The historical performance of Virat Industries shows fluctuations in key financial metrics over the years.<BR><BR>Breakdown:<BR>Virat Industries' net sales have seen a decline from INR 37.68 crore in March 2023 to INR 31.63 crore in March 2025, following a peak in March 2023. The total operating income mirrored this trend, decreasing from INR 37.68 crore in March 2023 to INR 31.63 crore in March 2025. The raw material cost increased slightly to INR 12.57 crore in March 2025 from INR 12.22 crore in March 2024, while employee costs rose to INR 6.29 crore in March 2025. The total expenditure, excluding depreciation, decreased to INR 30.40 crore in March 2025 from INR 34.63 crore in March 2023. Operating profit (PBDIT) also declined from INR 3.05 crore in March 2023 to INR 1.23 crore in March 2025, reflecting a drop in operating profit margin from 8.09% to 3.89%. Profit before tax decreased from INR 2.18 crore in March 2023 to INR 1.21 crore in March 2025, while profit after tax followed suit, dropping from INR 1.62 crore to INR 0.90 crore in the same period. The company’s total assets increased from INR 30.35 crore in March 2023 to INR 31.23 crore in March 2025, with total liabilities also rising slightly from INR 30.35 crore to INR 31.23 crore. Cash flow from operating activities showed a positive trend in March 2024 at INR 5.00 crore, contrasting with a negative cash flow of INR -1.00 crore in March 2023. Overall, Virat Industries has experienced a mixed financial performance, with declining sales and profits but an increase in total assets.

View full answer

Who are the top shareholders of the Virat Industries?

17-Jul-2025

The top shareholder of Virat Industries is Bhavook Tripathi, who owns 66.1% of the shares. Other significant shareholders include Shapoorjee Chandabhoy Finvest Private Ltd at 5.33% and individual investors with a combined 14.79%.

The top shareholders of Virat Industries are primarily the promoters, with Bhavook Tripathi holding the largest share at 66.1%. The highest public shareholder is Shapoorjee Chandabhoy Finvest Private Ltd, which owns 5.33%. Additionally, individual investors collectively hold 14.79% of the company's shares. There is also one foreign institutional investor (FII) that holds 0.03% of the shares. Notably, there are no pledged promoter holdings or mutual fund schemes involved in the shareholding.

View full answer

Is Virat Industries overvalued or undervalued?

09-Jun-2025

As of February 13, 2025, Virat Industries is considered very expensive and overvalued, with a PE ratio of 228.25 and a PEG ratio of 10.70, significantly higher than industry peers, despite a strong 1-year stock return of 236.08% compared to the Sensex's 7.60%.

As of 13 February 2025, the valuation grade for Virat Industries has moved from risky to very expensive. The company is currently overvalued based on its financial metrics. Key ratios include a PE ratio of 228.25, an EV to EBITDA of 182.98, and a ROE of 3.44%. <BR><BR>When compared to its peers in the Garments & Apparels industry, Virat Industries stands out with a significantly higher PE ratio than its competitors, indicating a premium valuation. For instance, while the industry average PE might hover around lower multiples, Virat's PEG ratio of 10.70 further emphasizes its overvaluation. Additionally, the company's recent stock performance has outpaced the Sensex, with a remarkable 1-year return of 236.08% compared to the Sensex's 7.60%, which may attract speculative interest despite the high valuation.

View full answer

What is the technical trend for Virat Industries?

09-Jun-2025

As of May 3, 2025, Virat Industries shows a bullish trend supported by positive weekly indicators, though caution is advised due to a bearish monthly RSI.

As of 3 May 2025, the technical trend for Virat Industries has changed from mildly bullish to bullish. The weekly MACD and KST indicators are both bullish, reinforcing the positive momentum. Daily moving averages also indicate a bullish stance. However, the monthly RSI shows a bearish signal, which suggests some caution at that time frame. Bollinger Bands are mildly bullish on both weekly and monthly charts, indicating a potential for continued upward movement. Overall, the current technical stance is bullish with strong support from weekly indicators, though the monthly RSI warrants attention.

View full answer

Has Virat Industries declared dividend?

06-Jun-2025

Yes, Virat Industries Ltd has declared a 10% dividend, amounting to 1 per share, with an ex-date of August 30, 2022. However, the dividend yield is 0%, indicating minimal returns from dividends compared to substantial price returns over various periods.

Virat Industries Ltd has declared a 10% dividend.<BR><BR>Dividend Details:<BR>- Percentage announced: 10%<BR>- Amount per share: 1 per share<BR>- Ex-date: 30 Aug 22<BR><BR>Dividend Yield: 0%<BR><BR>Total Returns by Period:<BR>In the 6-month period, the price return was 17.95%, with a dividend return of 0%, resulting in a total return of 17.95%.<BR><BR>For the 1-year period, the price return was 231.64%, with a dividend return of 0%, leading to a total return of 231.64%.<BR><BR>Over the 2-year period, the price return was 128.68%, and the dividend return was 0%, giving a total return of 128.68%.<BR><BR>In the 3-year period, the price return was 140.54%, with a dividend return of 0.50%, culminating in a total return of 141.04%.<BR><BR>For the 4-year period, the price return was 1178.07%, while the dividend return was 2.78%, resulting in a total return of 1180.85%.<BR><BR>In the 5-year period, the price return was 1550.93%, with a dividend return of 2.95%, leading to a total return of 1553.88%.<BR><BR>Overall, Virat Industries has declared a dividend, but the dividend yield remains at 0%, indicating that while the company has provided dividends, the returns from dividends have been minimal compared to the significant price returns over the periods analyzed.

View full answer
iScoreScore
Click here to find our call on this stock
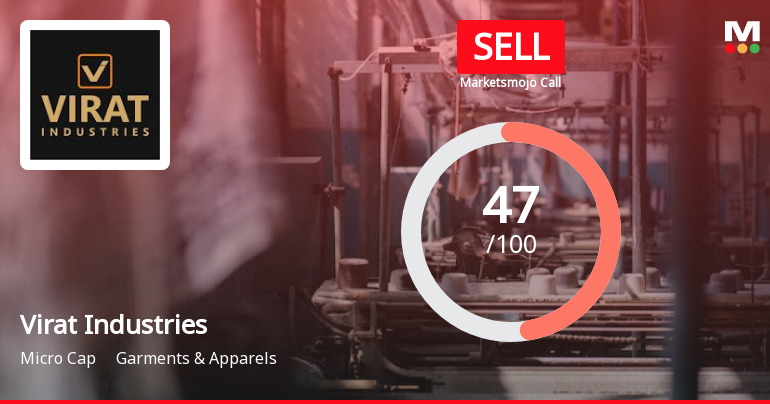
Strong Sell
Sell
Hold
Buy
Strong Buy

Dashboard

1

Poor Management Efficiency with a low ROE of 4.47%

  • The company has been able to generate a Return on Equity (avg) of 4.47% signifying low profitability per unit of shareholders funds
2

Poor long term growth as Net Sales has grown by an annual rate of 7.99% and Operating profit at 14.29% over the last 5 years

 
3

With ROE of 4.7, it has a Very Expensive valuation with a 4.9 Price to Book Value

stock-summaryMojo Parameters

Mojo Parameters

Loading Valuation Snapshot...

Stock DNA

stock-summary
Industry

Garments & Apparels

stock-summary
Market cap

INR Cr (Micro Cap)

stock-summary
P/E

103.00

stock-summary
Industry P/E

NA

stock-summary
Dividend Yield

0.00%

stock-summary
Debt Equity

0.00

stock-summary
Return on Equity

0.00%

stock-summary
Price to Book

0.00

Revenue and Profits:
Net Sales:
9 Cr
(Quarterly Results - Jun 2026)
Net Profit:
2 Cr
stock-summaryTotal Returns
Total Returns (Price + Dividend) stock-summary
Icon
Company does not have enough history
Risk Adjusted Returns v/s stock-summary
Returns Beta
Icon
Beta has not been calculated since enough price history is not available
stock-summaryNews & Corporate Actions

News

stock-summaryKey Factors

Quality key factors stock-summary

Factor
Value
Sales Growth (5y)
7.99%
EBIT Growth (5y)
14.29%
EBIT to Interest (avg)
1.04
Debt to EBITDA (avg)
0.44
Net Debt to Equity (avg)
-0.88
Sales to Capital Employed (avg)
1.01
Tax Ratio
25.81%
Dividend Payout Ratio
0
Pledged Shares
0
Institutional Holding
0
ROCE (avg)
3.86%
ROE (avg)
4.47%

Valuation key factors

Factor
Value
P/E Ratio
103
Industry P/E
28
Price to Book Value
4.89
EV to EBIT
301.44
EV to EBITDA
240.59
EV to Capital Employed
32.36
EV to Sales
18.97
PEG Ratio
3.09
Dividend Yield
NA
ROCE (Latest)
2.78%
ROE (Latest)
4.73%

Technicals key factors

Indicator
Weekly
Monthly
MACD
Mildly Bullish
Mildly Bearish
RSI
No Signal
No Signal
Bollinger Bands
Mildly Bullish
Bearish
Moving Averages
Mildly Bearish (Daily)
KST
Mildly Bullish
Mildly Bearish
Dow Theory
No Trend
No Trend
OBV
Bullish
No Trend
stock-summary Technical Indicator Scale: Bearish, Mildly Bearish, Sideways, Mildly Bullish, Bullish  Turned 
stock-summaryShareholding
Shareholding Snapshot : Jun 2026stock-summary
Shareholding Compare (%holding) stock-summary
Majority shareholders

Promoters

Pledged Promoter Holdings

None

Mutual Funds

Held by 0 Schemes

FIIs

Held by 0 FIIs

Promoter with highest holding

Bhavook Chandraprakash Tripathi (66.1%)

Highest Public shareholder

Shapoorjee Chandabhoy Finvest Private Ltd. (5.33%)

Individual Investors Holdings

12.49%

stock-summaryFinancial
[
  {
    "link": "quarterly",
    "btn_text": "All Quarterly Results",
    "header": "Quarterly Results Snapshot (Standalone) - Jun'26 - QoQ",
    "rhs": [
      {
        "prefix": "Net Sales ",
        "suffix": "QoQ Growth in quarter ended Jun 2026 is 85.49% vs -12.82% in Mar 2026",
        "dir": 1
      },
      {
        "prefix": "Standalone Net Profit ",
        "suffix": "QoQ Growth in quarter ended Jun 2026 is 102.86% vs -11.02% in Mar 2026",
        "dir": 1
      }
    ],
    "table": {
      "header": [
        "Jun'26",
        "Mar'26",
        "Change(%)"
      ],
      "body": [
        {
          "field": "Net Sales",
          "val1": "9.46",
          "val2": "5.10",
          "chgp": "85.49%",
          "chgp_class": "positive"
        },
        {
          "field": "Operating Profit (PBDIT) excl Other Income",
          "val1": "1.52",
          "val2": "-0.36",
          "chgp": "522.22%",
          "chgp_class": "positive"
        },
        {
          "field": "Interest",
          "val1": "0.01",
          "val2": "0.01",
          "chgp": "",
          "chgp_class": "neutral"
        },
        {
          "field": "Exceptional Items",
          "val1": "0.00",
          "val2": "0.00",
          "chgp": "",
          "chgp_class": "neutral"
        },
        {
          "field": "Standalone Net Profit",
          "val1": "2.13",
          "val2": "1.05",
          "chgp": "102.86%",
          "chgp_class": "positive"
        },
        {
          "field": "Operating Profit Margin (Excl OI)",
          "val1": "16.07%",
          "val2": "-7.06%",
          "chgp": "23.13%",
          "chgp_class": "positive"
        }
      ]
    }
  },
  {
    "link": "half-yearly",
    "btn_text": "All Half Yearly Results",
    "header": "Half Yearly Results Snapshot (Standalone) - Sep'25",
    "rhs": [
      {
        "prefix": "Net Sales ",
        "suffix": " Growth in half year ended Sep 2025 is -9.84% vs -3.62% in Sep 2024",
        "dir": -1
      },
      {
        "prefix": "Standalone Net Profit ",
        "suffix": " Growth in half year ended Sep 2025 is 344.26% vs -32.22% in Sep 2024",
        "dir": 1
      }
    ],
    "table": {
      "header": [
        "Sep'25",
        "Sep'24",
        "Change(%)"
      ],
      "body": [
        {
          "field": "Net Sales",
          "val1": "15.85",
          "val2": "17.58",
          "chgp": "-9.84%",
          "chgp_class": "negative"
        },
        {
          "field": "Operating Profit (PBDIT) excl Other Income",
          "val1": "1.05",
          "val2": "0.68",
          "chgp": "54.41%",
          "chgp_class": "positive"
        },
        {
          "field": "Interest",
          "val1": "0.03",
          "val2": "0.04",
          "chgp": "-25.00%",
          "chgp_class": "positive"
        },
        {
          "field": "Exceptional Items",
          "val1": "0.00",
          "val2": "0.00",
          "chgp": "",
          "chgp_class": "neutral"
        },
        {
          "field": "Standalone Net Profit",
          "val1": "2.71",
          "val2": "0.61",
          "chgp": "344.26%",
          "chgp_class": "positive"
        },
        {
          "field": "Operating Profit Margin (Excl OI)",
          "val1": "6.62%",
          "val2": "3.87%",
          "chgp": "2.75%",
          "chgp_class": "positive"
        }
      ]
    }
  },
  {
    "link": "nine-monthly",
    "btn_text": "All Nine Monthly Results",
    "header": "Nine Monthly Results Snapshot (Standalone) - Dec'25",
    "rhs": [
      {
        "prefix": "Net Sales ",
        "suffix": "YoY Growth in nine months ended Dec 2025 is -9.17% vs -10.52% in Dec 2024",
        "dir": 1
      },
      {
        "prefix": "Standalone Net Profit ",
        "suffix": "YoY Growth in nine months ended Dec 2025 is 432.88% vs 10.61% in Dec 2024",
        "dir": 1
      }
    ],
    "table": {
      "header": [
        "Dec'25",
        "Dec'24",
        "Change(%)"
      ],
      "body": [
        {
          "field": "Net Sales",
          "val1": "21.70",
          "val2": "23.89",
          "chgp": "-9.17%",
          "chgp_class": "negative"
        },
        {
          "field": "Operating Profit (PBDIT) excl Other Income",
          "val1": "1.33",
          "val2": "1.01",
          "chgp": "31.68%",
          "chgp_class": "positive"
        },
        {
          "field": "Interest",
          "val1": "0.04",
          "val2": "0.06",
          "chgp": "-33.33%",
          "chgp_class": "positive"
        },
        {
          "field": "Exceptional Items",
          "val1": "0.00",
          "val2": "0.00",
          "chgp": "",
          "chgp_class": "neutral"
        },
        {
          "field": "Standalone Net Profit",
          "val1": "3.89",
          "val2": "0.73",
          "chgp": "432.88%",
          "chgp_class": "positive"
        },
        {
          "field": "Operating Profit Margin (Excl OI)",
          "val1": "6.13%",
          "val2": "4.23%",
          "chgp": "1.90%",
          "chgp_class": "positive"
        }
      ]
    }
  },
  {
    "link": "annual",
    "btn_text": "All Annual Results",
    "header": "Annual Results Snapshot (Standalone) - Mar'26",
    "rhs": [
      {
        "prefix": "Net Sales ",
        "suffix": "YoY Growth in year ended Mar 2026 is -15.30% vs -2.44% in Mar 2025",
        "dir": -1
      },
      {
        "prefix": "Standalone Net Profit ",
        "suffix": "YoY Growth in year ended Mar 2026 is 448.89% vs 18.42% in Mar 2025",
        "dir": 1
      }
    ],
    "table": {
      "header": [
        "Mar'26",
        "Mar'25",
        "Change(%)"
      ],
      "body": [
        {
          "field": "Net Sales",
          "val1": "26.79",
          "val2": "31.63",
          "chgp": "-15.30%",
          "chgp_class": "negative"
        },
        {
          "field": "Operating Profit (PBDIT) excl Other Income",
          "val1": "0.95",
          "val2": "1.23",
          "chgp": "-22.76%",
          "chgp_class": "negative"
        },
        {
          "field": "Interest",
          "val1": "0.05",
          "val2": "0.07",
          "chgp": "-28.57%",
          "chgp_class": "positive"
        },
        {
          "field": "Exceptional Items",
          "val1": "0.00",
          "val2": "0.00",
          "chgp": "",
          "chgp_class": "neutral"
        },
        {
          "field": "Standalone Net Profit",
          "val1": "4.94",
          "val2": "0.90",
          "chgp": "448.89%",
          "chgp_class": "positive"
        },
        {
          "field": "Operating Profit Margin (Excl OI)",
          "val1": "3.55%",
          "val2": "3.89%",
          "chgp": "-0.34%",
          "chgp_class": "negative"
        }
      ]
    }
  }
]

Quarterly Results Snapshot (Standalone) - Jun'26 - QoQstock-summary

Jun'26
Mar'26
Change(%)
Net Sales
9.46
5.10
85.49%
Operating Profit (PBDIT) excl Other Income
1.52
-0.36
522.22%
Interest
0.01
0.01
Exceptional Items
0.00
0.00
Standalone Net Profit
2.13
1.05
102.86%
Operating Profit Margin (Excl OI)
16.07%
-7.06%
23.13%
Values in Rs Cr.
Direction Arrows
Net Sales

QoQ Growth in quarter ended Jun 2026 is 85.49% vs -12.82% in Mar 2026

Direction Arrows
Standalone Net Profit

QoQ Growth in quarter ended Jun 2026 is 102.86% vs -11.02% in Mar 2026

Half Yearly Results Snapshot (Standalone) - Sep'25stock-summary

Sep'25
Sep'24
Change(%)
Net Sales
15.85
17.58
-9.84%
Operating Profit (PBDIT) excl Other Income
1.05
0.68
54.41%
Interest
0.03
0.04
-25.00%
Exceptional Items
0.00
0.00
Standalone Net Profit
2.71
0.61
344.26%
Operating Profit Margin (Excl OI)
6.62%
3.87%
2.75%
Values in Rs Cr.
Direction Arrows
Net Sales

Growth in half year ended Sep 2025 is -9.84% vs -3.62% in Sep 2024

Direction Arrows
Standalone Net Profit

Growth in half year ended Sep 2025 is 344.26% vs -32.22% in Sep 2024

Nine Monthly Results Snapshot (Standalone) - Dec'25stock-summary

Dec'25
Dec'24
Change(%)
Net Sales
21.70
23.89
-9.17%
Operating Profit (PBDIT) excl Other Income
1.33
1.01
31.68%
Interest
0.04
0.06
-33.33%
Exceptional Items
0.00
0.00
Standalone Net Profit
3.89
0.73
432.88%
Operating Profit Margin (Excl OI)
6.13%
4.23%
1.90%
Values in Rs Cr.
Direction Arrows
Net Sales

YoY Growth in nine months ended Dec 2025 is -9.17% vs -10.52% in Dec 2024

Direction Arrows
Standalone Net Profit

YoY Growth in nine months ended Dec 2025 is 432.88% vs 10.61% in Dec 2024

Annual Results Snapshot (Standalone) - Mar'26stock-summary

Mar'26
Mar'25
Change(%)
Net Sales
26.79
31.63
-15.30%
Operating Profit (PBDIT) excl Other Income
0.95
1.23
-22.76%
Interest
0.05
0.07
-28.57%
Exceptional Items
0.00
0.00
Standalone Net Profit
4.94
0.90
448.89%
Operating Profit Margin (Excl OI)
3.55%
3.89%
-0.34%
Values in Rs Cr.
Direction Arrows
Net Sales

YoY Growth in year ended Mar 2026 is -15.30% vs -2.44% in Mar 2025

Direction Arrows
Standalone Net Profit

YoY Growth in year ended Mar 2026 is 448.89% vs 18.42% in Mar 2025

stock-summaryCompany CV
About Virat Industries Ltd stock-summary
stock-summary
Virat Industries Ltd
Micro Cap
Garments & Apparels
Virat Industries Limited (VIL), established in 1990, manufacture excellent quality socks for export mainly to European markets. The Company started its operations in 1995 and completed more than a decade in Socks business. The socks manufactured on the latest computerized electronic knitting machines by Lonati and Matec, Italy and KTM, Korea supported with balancing equipment from Spain and other European markets. The production capacity is normally based on size, design and style of socks.
Company Coordinates stock-summary
Company Details
A-1/2 GIDC Indl Estate, Kabilpore Navasari Navsari Gujarat : 396424
stock-summary
Tel: 91-2637-265011/265022
stock-summary
factory@viratindustries.com
Registrar Details
Link Intime India Pvt Ltd, C-13 Pannalal Silk Compound, L B S Marg, Bhandup , Mumbai