
Compare Virco Manufacturing Corp. with Similar Stocks
Dashboard
With a fall in Net Sales of -15.06%, the company declared Very Negative results in Jul 25
- The company has declared negative results in Jan 25 after 3 consecutive negative quarters
- ROCE(HY) Lowest at 12.18%
- INVENTORY TURNOVER RATIO(HY) Lowest at 2.29 times
- NET SALES(Q) Fallen at -15.06%
With ROE of 18.80%, it has a attractive valuation with a 1.23 Price to Book Value
Below par performance in long term as well as near term
Total Returns (Price + Dividend) 
Virco Manufacturing Corp. for the last several years.
Risk Adjusted Returns v/s
News
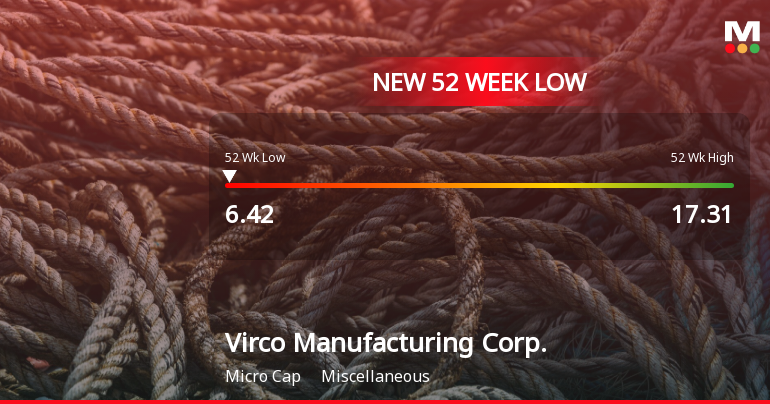
Virco Manufacturing Corp. Stock Plummets to New 52-Week Low of $6.42
Virco Manufacturing Corp. has reached a new 52-week low, trading at USD 6.42. The company has seen a significant stock decline of 58.61% over the past year, with recent financial results showing a 15.06% drop in net sales and a low inventory turnover ratio, indicating ongoing challenges.
Read full news article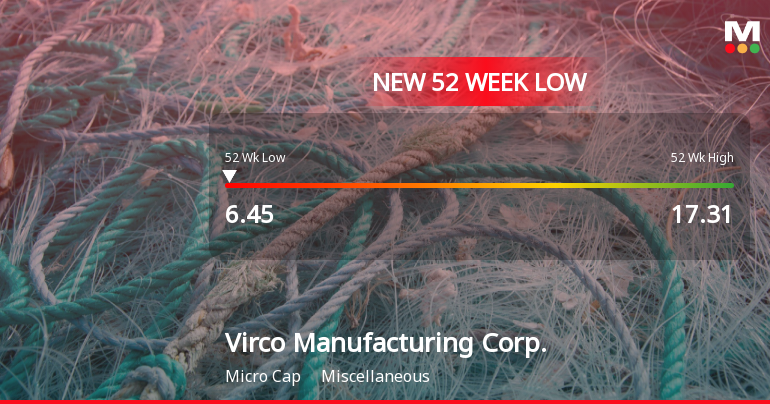
Virco Manufacturing Corp. Hits New 52-Week Low at $6.45
Virco Manufacturing Corp. has hit a new 52-week low, trading at USD 6.45, reflecting a significant decline over the past year. The company has a market capitalization of USD 129 million, a P/E ratio of 7.00, and a high dividend yield, but faces challenges in financial performance metrics.
Read full news article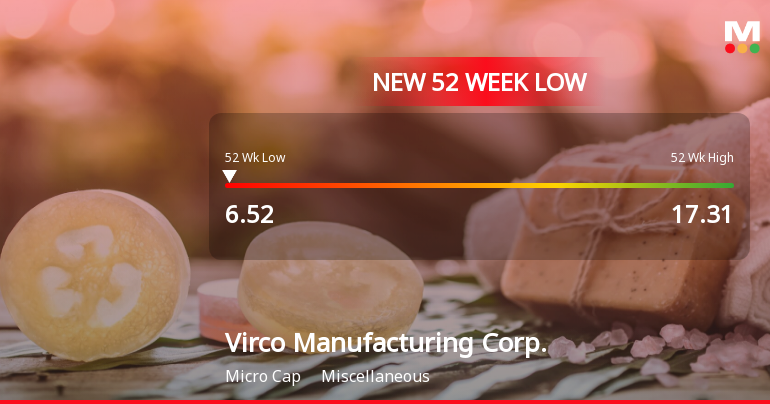
Virco Manufacturing Corp. Stock Plummets to New 52-Week Low of $6.52
Virco Manufacturing Corp. has hit a new 52-week low, with its stock price significantly declining over the past year. The company, with a market cap of USD 129 million, reported a 15.06% drop in net sales and a low inventory turnover ratio, reflecting ongoing operational challenges.
Read full news article Announcements

Corporate Actions
Quality key factors
Valuation key factors
Technicals key factors
 Technical Indicator Scale: Bearish, Mildly Bearish, Sideways, Mildly Bullish, Bullish Turned
 Shareholding Snapshot : Oct 2025
Shareholding Compare (%holding)
Domestic Funds
Held in 34 Schemes (21.29%)
Held by 35 Foreign Institutions (5.3%)
Quarterly Results Snapshot (Consolidated) - Jul'25 - YoY

YoY Growth in quarter ended Jul 2025 is -15.04% vs 1.03% in Jul 2024
YoY Growth in quarter ended Jul 2025 is -39.29% vs 8.39% in Jul 2024
Annual Results Snapshot (Consolidated) - Jan'25
YoY Growth in year ended Jan 2025 is -1.08% vs 16.44% in Jan 2024
YoY Growth in year ended Jan 2025 is -1.37% vs 32.73% in Jan 2024
About Virco Manufacturing Corp.

Company Coordinates


