
Compare VISA Chrome with Similar Stocks
Dashboard
With a Negative Book Value, the company has a Weak Long Term Fundamental Strength
- Poor long term growth as Net Sales has grown by an annual rate of -10.47% and Operating profit at 0% over the last 5 years
- The company has a negative book value of Rs 219.86 crore
Flat results in Mar 26
Risky - Negative Operating Profits
Stock DNA
Ferrous Metals
INR 606 Cr (Micro Cap)
NA (Loss Making)
26
0.00%
-1.77
17.72%
-2.75
Total Returns (Price + Dividend) 
Latest dividend: 0.9500 per share ex-dividend date: Jul-14-2011
Risk Adjusted Returns v/s
Returns Beta

News
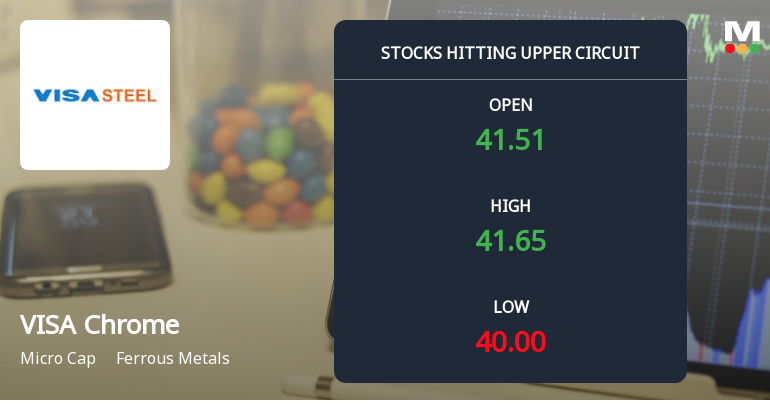
Upper Circuit at Rs 42.89: Is Visa Steel Ltd’s 5% Surge Driven by Conviction or Thin Liquidity?
At Rs 42.89, the buying was done — not because demand dried up, but because the exchange wouldn't allow the stock to rise further. Visa Steel Ltd locked at its upper circuit of 5% on 12 Jun 2026, with buyers queuing and no sellers willing to part with shares, signalling unfilled demand in a micro-cap environment.
Read full news article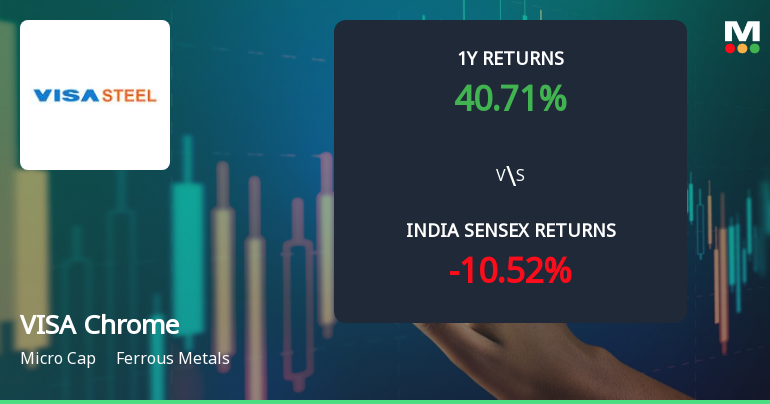
Visa Steel Ltd Faces Technical Momentum Shift Amid Bearish Signals
Visa Steel Ltd, a micro-cap player in the ferrous metals sector, has experienced a notable shift in its technical momentum, signalling a transition from a sideways trend to a mildly bearish outlook. This change is underscored by mixed technical indicators, including MACD, RSI, moving averages, and other momentum oscillators, reflecting a complex market sentiment as the stock price declined by 4.99% on 12 Jun 2026.
Read full news article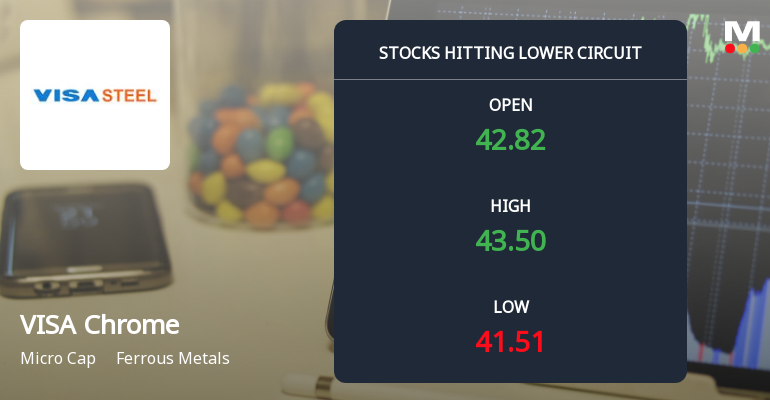
Below All Moving Averages and Now at Lower Circuit: Visa Steel Ltd Loses 4.99% in a Single Session
At Rs 40.81, sellers were still queuing — but there were no buyers willing to take the other side. Visa Steel Ltd locked at its lower circuit of 4.99% on 11 Jun 2026, with unfilled sell orders and a frozen price, reflecting persistent selling pressure in a micro-cap stock with limited liquidity.
Read full news article Announcements
Disclosures under Reg. 29(2) of SEBI (SAST) Regulations 2011
08-Jun-2026 | Source : BSEThe Exchange has received the disclosure under Regulation 29(2) of SEBI (Substantial Acquisition of Shares & Takeovers) Regulations 2011 for Assets Care & Reconstruction Enterprise Ltd
Compliances-Reg.24(A)-Annual Secretarial Compliance
30-May-2026 | Source : BSEAnnual Secretarial Compliance Report for the year ended March 31 2026.
Announcement under Regulation 30 (LODR)-Newspaper Publication
27-May-2026 | Source : BSEPublication of Audited Standalone and Consolidated Financial Results for the Quarter and year ended March 31 2026.
Corporate Actions

No Upcoming Board Meetings

VISA Chrome Ltd has declared 10% dividend, ex-date: 14 Jul 11

No Splits history available

No Bonus history available

No Rights history available
Quality key factors
Valuation key factors
Technicals key factors
 Technical Indicator Scale: Bearish, Mildly Bearish, Sideways, Mildly Bullish, Bullish Turned
 Shareholding Snapshot : Apr 2026
Shareholding Compare (%holding)
Promoters
48.7893
Held by 0 Schemes
Held by 2 FIIs (10.6%)
Visa Industries Limited (31.96%)
Visa International Limited (16.32%)
5.55%
Quarterly Results Snapshot (Consolidated) - Mar'26 - QoQ

QoQ Growth in quarter ended Mar 2026 is 17.94% vs 94.07% in Dec 2025

QoQ Growth in quarter ended Mar 2026 is 6,649.18% vs 18.25% in Dec 2025
Half Yearly Results Snapshot (Consolidated) - Sep'25
Growth in half year ended Sep 2025 is -13.50% vs -32.73% in Sep 2024
Growth in half year ended Sep 2025 is -43.63% vs 71.36% in Sep 2024
Nine Monthly Results Snapshot (Consolidated) - Dec'25
YoY Growth in nine months ended Dec 2025 is -3.05% vs -21.35% in Dec 2024
YoY Growth in nine months ended Dec 2025 is -14.43% vs 55.02% in Dec 2024
Annual Results Snapshot (Consolidated) - Mar'26
YoY Growth in year ended Mar 2026 is -0.81% vs -15.48% in Mar 2025
YoY Growth in year ended Mar 2026 is 303.30% vs -618.53% in Mar 2025
About VISA Chrome Ltd

Company Coordinates


