
Compare Visagar Polytex with Similar Stocks
Stock DNA
Garments & Apparels
INR 16 Cr (Micro Cap)
NA (Loss Making)
23
0.00%
-6.29
1,590.00%
-16.10
Total Returns (Price + Dividend) 
Latest dividend: 0.03 per share ex-dividend date: Sep-22-2015
Risk Adjusted Returns v/s
Returns Beta

News

Visagar Polytex Ltd Downgraded to Strong Sell Amid Deteriorating Fundamentals and Bearish Technicals
Visagar Polytex Ltd, a micro-cap player in the Garments & Apparels sector, has been downgraded to a Strong Sell rating by MarketsMOJO as of 1 June 2026. This decisive rating change reflects deteriorating quality metrics, unfavourable valuation, a weakening financial trend, and bearish technical indicators, signalling heightened risk for investors.
Read full news article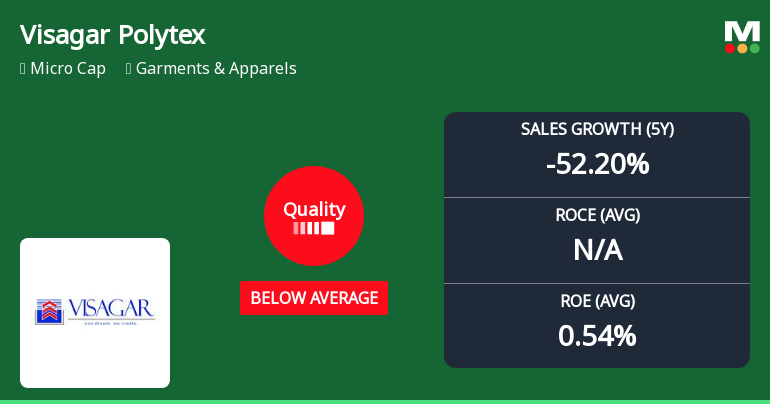
Visagar Polytex Ltd Downgraded to Below Average Quality Amidst Deteriorating Fundamentals
Visagar Polytex Ltd, a micro-cap player in the Garments & Apparels sector, has seen its quality grading downgraded from "Does Not Qualify" to "Below Average" as of 1 June 2026, reflecting a marked deterioration in its business fundamentals. The company’s financial metrics reveal significant declines in profitability, growth, and leverage management, raising concerns about its operational sustainability and investment appeal.
Read full news article Announcements
Visagar Polytex Limited - Updates
09-Dec-2019 | Source : NSEVisagar Polytex Limited has informed the Exchange regarding 'Details required under Point 7(B) (i), (ii) and (iii) of Para A of Part A of Schedule III to SEBI (Listing Obligations and Disclosure Requirements) Regulations, 2015 [SEBI LODR]'.
Visagar Polytex Limited - Outcome of Board Meeting
05-Dec-2019 | Source : NSEVisagar Polytex Limited has informed the Exchange regarding Board meeting held on December 05, 2019.
Visagar Polytex Limited - Outcome of Board Meeting
15-Nov-2019 | Source : NSEVisagar Polytex Limited has informed the Exchange regarding Board meeting held on November 14, 2019.
Corporate Actions

No Upcoming Board Meetings

Visagar Polytex Ltd has declared 3% dividend, ex-date: 22 Sep 15

Visagar Polytex Ltd has announced 1:10 stock split, ex-date: 21 Jan 10

Visagar Polytex Ltd has announced 1:3 bonus issue, ex-date: 30 Mar 16

Visagar Polytex Ltd has announced 2:1 rights issue, ex-date: 10 Apr 08
Quality key factors
Valuation key factors
Technicals key factors
 Technical Indicator Scale: Bearish, Mildly Bearish, Sideways, Mildly Bullish, Bullish Turned
 Shareholding Snapshot : Mar 2026
Shareholding Compare (%holding)
Non Institution
83.6945
Held by 0 Schemes
Held by 0 FIIs
Tilokchand Manaklal Kothari (4.71%)
None
89.11%
Quarterly Results Snapshot (Standalone) - Mar'26 - YoY
YoY Growth in quarter ended Mar 2026 is 0.00% vs 0.00% in Mar 2025

YoY Growth in quarter ended Mar 2026 is 16.00% vs 96.57% in Mar 2025
Half Yearly Results Snapshot (Standalone) - Sep'25
Growth in half year ended Sep 2025 is 0.00% vs 0.00% in Sep 2024
Growth in half year ended Sep 2025 is -4.65% vs 16.50% in Sep 2024
Nine Monthly Results Snapshot (Standalone) - Dec'25

YoY Growth in nine months ended Dec 2025 is 0.00% vs -100.00% in Dec 2024
YoY Growth in nine months ended Dec 2025 is 5.08% vs -24.21% in Dec 2024
Annual Results Snapshot (Standalone) - Mar'26
YoY Growth in year ended Mar 2026 is 0.00% vs -100.00% in Mar 2025
YoY Growth in year ended Mar 2026 is 7.23% vs 89.31% in Mar 2025
About Visagar Polytex Ltd

Company Coordinates


