
Key Events This Week
15 Jun: Stock steady at Rs.113.25 despite Sensex rally
16 Jun: Valuation shifts signal attractive entry amid mixed market returns
19 Jun: Stock hits lower circuit, closing at Rs.107.60 (-4.99%)
Jun 19, 03:30 PM
BSE+NSE Vol: 1000
Visaman Global for the last several years.

15 Jun: Stock steady at Rs.113.25 despite Sensex rally
16 Jun: Valuation shifts signal attractive entry amid mixed market returns
19 Jun: Stock hits lower circuit, closing at Rs.107.60 (-4.99%)
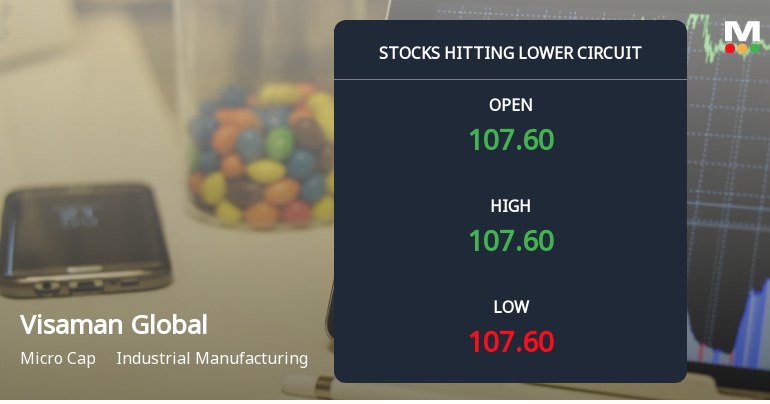
At Rs 107.6, sellers were still queuing — but there were no buyers willing to take the other side. Visaman Global Sales Ltd locked at its lower circuit of 4.99% on 19 Jun 2026, with unfilled sell orders and a frozen price.
Read full news article
Visaman Global Sales Ltd, a micro-cap player in the industrial manufacturing sector, has seen a notable shift in its valuation parameters, moving from a fair to an attractive rating. Despite a challenging year-to-date return of -12.14%, the company’s price-to-earnings (P/E) and price-to-book value (P/BV) ratios suggest a compelling investment case when compared with peers and historical benchmarks.
Read full news article
No Upcoming Board Meetings

No Dividend history available

No Splits history available

No Bonus history available

No Rights history available
 Technical Indicator Scale: Bearish, Mildly Bearish, Sideways, Mildly Bullish, Bullish Turned
 Promoters
None
Held by 0 Schemes
Held by 0 FIIs
Sureshchandra Gulabchand Vasa (26.61%)
Mayuri Shripal Vora (4.32%)
39.22%

Growth in half year ended Sep 2025 is -14.90% vs -6.61% in Mar 2025

Growth in half year ended Sep 2025 is 245.78% vs -36.64% in Mar 2025
YoY Growth in year ended Mar 2025 is -13.74% vs -24.47% in Mar 2024
YoY Growth in year ended Mar 2025 is 63.36% vs 5.65% in Mar 2024


