
Compare Vishnu Prakash R with Similar Stocks
Dashboard
With a Operating Losses, the company has a Weak Long Term Fundamental Strength
- Company's ability to service its debt is weak with a poor EBIT to Interest (avg) ratio of 1.76
- The company has been able to generate a Return on Equity (avg) of 8.15% signifying low profitability per unit of shareholders funds
With a fall in Operating Profit of -663.74%, the company declared Very Negative results in Mar 26
Risky - Negative EBITDA
87.71% of Promoter Shares are Pledged
Below par performance in long term as well as near term
Stock DNA
Construction
INR 405 Cr (Micro Cap)
NA (Loss Making)
33
0.00%
0.94
-22.25%
0.68
Total Returns (Price + Dividend) 
Vishnu Prakash R for the last several years.
Risk Adjusted Returns v/s
Returns Beta

News

Below All Moving Averages and Now at Lower Circuit: Vishnu Prakash R Punglia Ltd Loses 5.0% in a Single Session
At Rs 32.52, sellers were still queuing — but there were no buyers willing to take the other side. Vishnu Prakash R Punglia Ltd locked at its lower circuit of 5.0% on 4 Jun 2026, with unfilled sell orders and a frozen price, reflecting persistent selling pressure in a micro-cap stock with limited liquidity.
Read full news article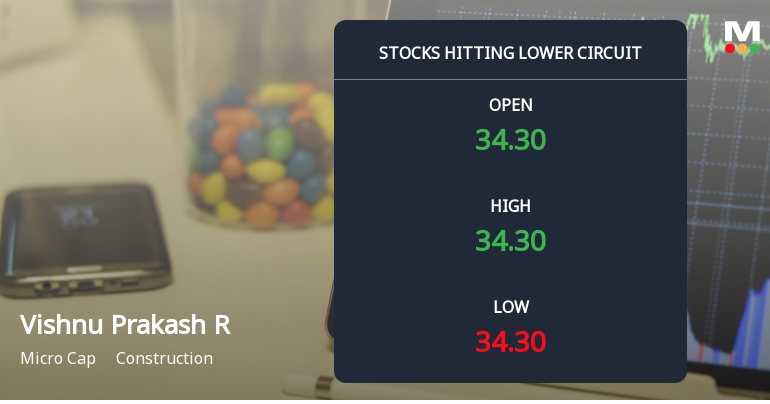
Below All Moving Averages and Now at Lower Circuit: Vishnu Prakash R Punglia Ltd Loses 5.0% in a Single Session
At Rs 34.23, sellers were still queuing — but there were no buyers willing to take the other side. Vishnu Prakash R Punglia Ltd locked at its lower circuit of 5.0% on 3 Jun 2026, with unfilled sell orders and a frozen price, reflecting persistent selling pressure in a micro-cap stock with limited liquidity.
Read full news article
Vishnu Prakash R Punglia Ltd Locks at Lower Circuit With 5.0% Loss — Sellers Queue, No Buyers in Sight
At Rs 36.03, sellers were still queuing — but there were no buyers willing to take the other side. Vishnu Prakash R Punglia Ltd locked at its lower circuit of 5.0% on 2 Jun 2026, with unfilled sell orders and a frozen price, signalling a pronounced imbalance in supply and demand.
Read full news article Announcements
Corporate Actions

No Upcoming Board Meetings

No Dividend history available

No Splits history available

No Bonus history available

No Rights history available
Quality key factors
Valuation key factors
Technicals key factors
 Technical Indicator Scale: Bearish, Mildly Bearish, Sideways, Mildly Bullish, Bullish Turned
 Shareholding Snapshot : Mar 2026
Shareholding Compare (%holding)
Non Institution
87.7078
Held by 2 Schemes (4.08%)
Held by 3 FIIs (0.27%)
Vishnu Prakash Punglia (8.56%)
Quant Mutual Fund - Quant Small Cap Fund (4.08%)
45.27%
Quarterly Results Snapshot (Standalone) - Mar'26 - QoQ

QoQ Growth in quarter ended Mar 2026 is -42.74% vs -39.98% in Dec 2025

QoQ Growth in quarter ended Mar 2026 is -336.26% vs -921.37% in Dec 2025
Half Yearly Results Snapshot (Standalone) - Sep'25
Growth in half year ended Sep 2025 is -3.27% vs 2.93% in Sep 2024
Growth in half year ended Sep 2025 is -72.31% vs 2.18% in Sep 2024
Nine Monthly Results Snapshot (Standalone) - Dec'25
YoY Growth in nine months ended Dec 2025 is -9.95% vs 1.92% in Dec 2024
YoY Growth in nine months ended Dec 2025 is -145.61% vs -23.05% in Dec 2024
Annual Results Snapshot (Standalone) - Mar'26
YoY Growth in year ended Mar 2026 is -31.21% vs -16.04% in Mar 2025
YoY Growth in year ended Mar 2026 is -356.18% vs -52.04% in Mar 2025
About Vishnu Prakash R Punglia Ltd

Company Coordinates


