
Compare Vishvprabha Ven. with Similar Stocks
Dashboard
High Debt company with Weak Long Term Fundamental Strength
- Poor long term growth as Operating profit has grown by an annual rate -4.36% of over the last 5 years
- High Debt Company with a Debt to Equity ratio (avg) of 2.29 times
- The company has reported losses. Due to this company has reported negative ROE
Flat results in Mar 26
Risky - Negative Operating Profits
Underperformed the market in the last 1 year
Stock DNA
Diversified Commercial Services
INR 12 Cr (Micro Cap)
NA (Loss Making)
23
0.00%
2.55
-20.38%
1.84
Total Returns (Price + Dividend) 
Latest dividend: 0.5 per share ex-dividend date: Sep-23-2024
Risk Adjusted Returns v/s
Returns Beta

News
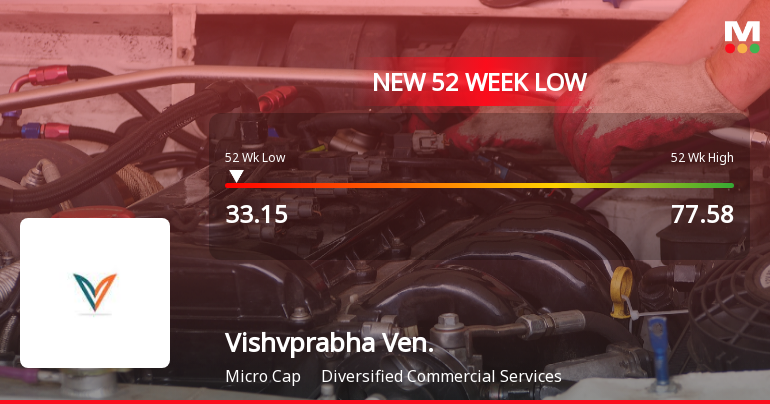
Markets Rally, But Vishvprabha Ventures Ltd Sinks to 52-Week Low in Stock-Specific Sell-Off
Despite a broadly positive market environment, Vishvprabha Ventures Ltd has plunged to a fresh 52-week low of Rs 33.15 on 15 Jun 2026, marking a steep 8.35% intraday decline and extending its year-long slide to over 52%. This stark underperformance contrasts sharply with the Sensex’s 1.57% gain on the same day, underscoring the stock’s isolated weakness.
Read full news article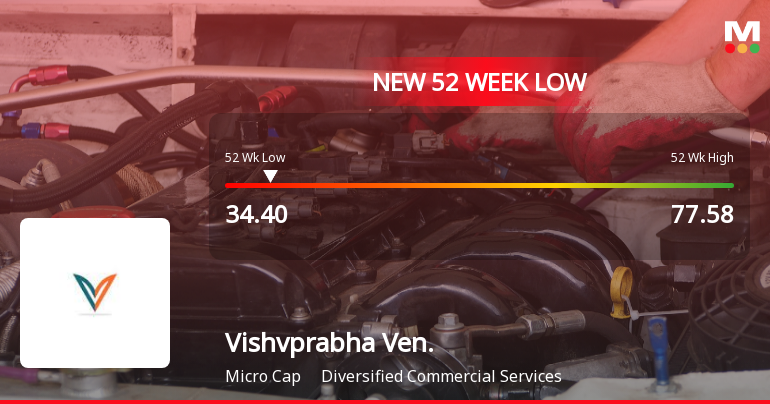
Are Vishvprabha Ventures Ltd latest results good or bad?
Vishvprabha Ventures Ltd's latest financial results for the quarter ended March 2026 reveal a complex picture of operational challenges despite some revenue growth. The company reported net sales of ₹1.69 crores, reflecting a significant quarter-on-quarter increase of 72.45% and a year-on-year growth of 64.08%. However, this revenue surge has not translated into profitability, as the company incurred a net loss of ₹0.35 crores, marking a 53.33% deterioration from the previous quarter. The operational metrics indicate a persistent struggle with profitability, as the operating profit margin, excluding other income, was a mere 0.59%, showing a stark contrast to the previous quarter's negative margin. Additionally, the company's return on equity (ROE) stands at a negative -7.62%, highlighting ongoing issues in generating shareholder value. The financial health of Vishvprabha Ventures is concerning, with a hig...
Read full news article Announcements
Newspaper Publication - Financial Results
01-Jun-2026 | Source : BSENewspaper Publication for Financial Results for the financial year ended 31st March 2026.
Audited Standalone And Consolidated Financial Results Of The Company For The Quarter And Financial Year Ended March 31 2026.
30-May-2026 | Source : BSEAudited Standalone and Consolidated Financial results for year ended March 312026
Board Meeting Outcome for OUTCOME OF BM
30-May-2026 | Source : BSEOUTCOME OF BOARD MEETING
Corporate Actions

No Upcoming Board Meetings

Vishvprabha Ventures Ltd has declared 5% dividend, ex-date: 23 Sep 24

No Splits history available

No Bonus history available

Vishvprabha Ventures Ltd has announced 9:11 rights issue, ex-date: 07 Aug 24
Quality key factors
Valuation key factors
Technicals key factors
 Technical Indicator Scale: Bearish, Mildly Bearish, Sideways, Mildly Bullish, Bullish Turned
 Shareholding Snapshot : Mar 2026
Shareholding Compare (%holding)
Promoters
None
Held by 0 Schemes
Held by 0 FIIs
Mitesh Jayantilal Thakkar (58.97%)
Gulshan Investment Company Private Ltd (4.47%)
31.77%
Quarterly Results Snapshot (Consolidated) - Mar'26 - QoQ

QoQ Growth in quarter ended Mar 2026 is 72.45% vs -80.00% in Dec 2025
QoQ Growth in quarter ended Mar 2026 is 53.33% vs -516.67% in Dec 2025
Half Yearly Results Snapshot (Consolidated) - Sep'25

Growth in half year ended Sep 2025 is 26.61% vs 115.25% in Sep 2024
Growth in half year ended Sep 2025 is -190.00% vs 7.14% in Sep 2024
Nine Monthly Results Snapshot (Consolidated) - Dec'25
YoY Growth in nine months ended Dec 2025 is 1.35% vs 70.50% in Dec 2024
YoY Growth in nine months ended Dec 2025 is -429.03% vs 542.86% in Dec 2024
Annual Results Snapshot (Consolidated) - Mar'26
YoY Growth in year ended Mar 2026 is 7.96% vs 66.72% in Mar 2025
YoY Growth in year ended Mar 2026 is -6,750.00% vs 92.59% in Mar 2025
About Vishvprabha Ventures Ltd

Company Coordinates


