
Compare Vishwaraj Sugar with Similar Stocks
Dashboard
Weak Long Term Fundamental Strength with a -188.77% CAGR growth in Operating Profits over the last 5 years
- Low ability to service debt as the company has a high Debt to EBITDA ratio of -43.31 times
- The company has been able to generate a Return on Equity (avg) of 4.99% signifying low profitability per unit of shareholders funds
The company has declared Negative results for the last 3 consecutive quarters
Risky - Negative EBITDA
Falling Participation by Institutional Investors
Stock DNA
Sugar
INR 117 Cr (Micro Cap)
NA (Loss Making)
21
0.00%
1.65
-10.49%
0.46
Total Returns (Price + Dividend) 
Latest dividend: 0.2 per share ex-dividend date: Sep-20-2024
Risk Adjusted Returns v/s
Returns Beta

News
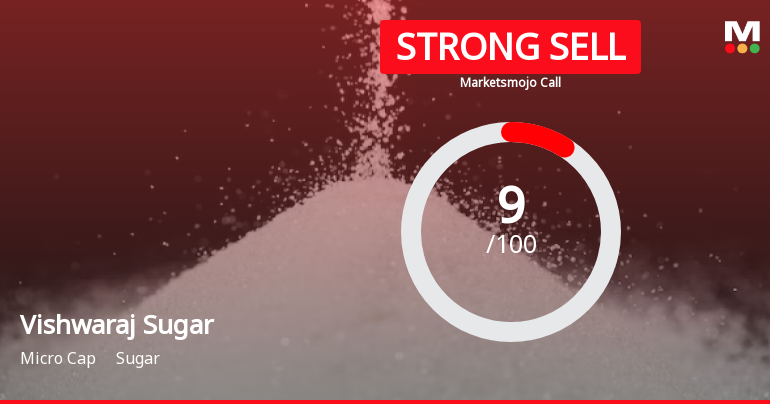
Vishwaraj Sugar Industries Ltd is Rated Strong Sell
Vishwaraj Sugar Industries Ltd is rated Strong Sell by MarketsMOJO, with this rating last updated on 02 June 2025. However, the analysis and financial metrics discussed here reflect the stock’s current position as of 08 July 2026, providing investors with an up-to-date perspective on the company’s fundamentals, valuation, financial trends, and technical outlook.
Read full news article
Vishwaraj Sugar Industries Ltd is Rated Strong Sell
Vishwaraj Sugar Industries Ltd is rated Strong Sell by MarketsMOJO. This rating was last updated on 02 Jun 2025. However, the analysis and financial metrics presented here reflect the stock’s current position as of 27 June 2026, providing investors with an up-to-date view of the company’s fundamentals, returns, and market standing.
Read full news article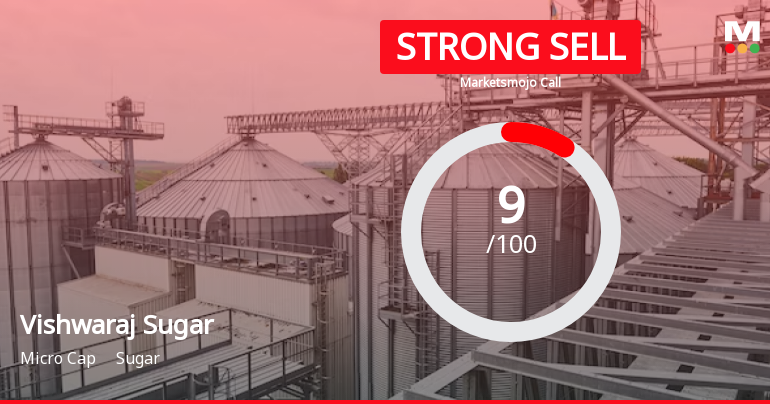
Vishwaraj Sugar Industries Ltd is Rated Strong Sell
Vishwaraj Sugar Industries Ltd is rated Strong Sell by MarketsMOJO, with this rating last updated on 02 June 2025. However, the analysis and financial metrics discussed here reflect the stock's current position as of 16 June 2026, providing investors with an up-to-date perspective on the company’s performance and outlook.
Read full news article Announcements
Compliances-Certificate under Reg. 74 (5) of SEBI (DP) Regulations 2018
15-Jul-2026 | Source : BSEWe are submitting herewith a copy of the certificate under Regulation 74(5) issued by the RTA of the Company for the quarter ended June 30 2026.
Closure of Trading Window
22-Jun-2026 | Source : BSEWe are submitting the trading window closure for the quarter ending on June 30 2026
Compliances-Reg.24(A)-Annual Secretarial Compliance
30-May-2026 | Source : BSEPursuant to the provisions of Regulation 24A of SEBI (LODR) Regulations 2015 we are herewith submitting the Annual Secretarial Compliance Report for the year ended March 31 2026.
Corporate Actions

No Upcoming Board Meetings

Vishwaraj Sugar Industries Ltd has declared 10% dividend, ex-date: 20 Sep 24

Vishwaraj Sugar Industries Ltd has announced 2:10 stock split, ex-date: 21 Oct 21

No Bonus history available

No Rights history available
Quality key factors
Valuation key factors
Technicals key factors
 Technical Indicator Scale: Bearish, Mildly Bearish, Sideways, Mildly Bullish, Bullish Turned
 Shareholding Snapshot : Mar 2026
Shareholding Compare (%holding)
Non Institution
None
Held by 0 Schemes
Held by 0 FIIs
Nikhil Umesh Katti (11.73%)
Neomile Growth Fund - Series I (2.03%)
63.65%
Quarterly Results Snapshot (Standalone) - Mar'26 - QoQ

QoQ Growth in quarter ended Mar 2026 is 42.93% vs 41.13% in Dec 2025
QoQ Growth in quarter ended Mar 2026 is 262.89% vs 53.31% in Dec 2025
Half Yearly Results Snapshot (Standalone) - Sep'25
Growth in half year ended Sep 2025 is -3.06% vs -30.64% in Sep 2024
Growth in half year ended Sep 2025 is 21.17% vs -90.09% in Sep 2024
Nine Monthly Results Snapshot (Standalone) - Dec'25
YoY Growth in nine months ended Dec 2025 is -7.47% vs -25.58% in Dec 2024
YoY Growth in nine months ended Dec 2025 is 2.44% vs -461.07% in Dec 2024
Annual Results Snapshot (Standalone) - Mar'26
YoY Growth in year ended Mar 2026 is -16.99% vs -17.42% in Mar 2025
YoY Growth in year ended Mar 2026 is 23.91% vs -355.31% in Mar 2025
About Vishwaraj Sugar Industries Ltd

Company Coordinates


