
 Price Point
Compare Vista Pharma. with Similar Stocks
ScoreDashboard
With a Operating Losses, the company has a Weak Long Term Fundamental Strength
- Company's ability to service its debt is weak with a poor EBIT to Interest (avg) ratio of -5.54
Flat results in Jun 26
Risky - Negative EBITDA
Consistent Underperformance against the benchmark over the last 3 years
Mojo ParametersStock DNA

Pharmaceuticals & Biotechnology

INR 37 Cr (Micro Cap)

NA (Loss Making)
37

0.00%

0.27

-32.27%

1.05
Total ReturnsTotal Returns (Price + Dividend) 
Vista Pharma. for the last several years.
Risk Adjusted Returns v/s
Returns Beta
 News & Corporate Actions
News
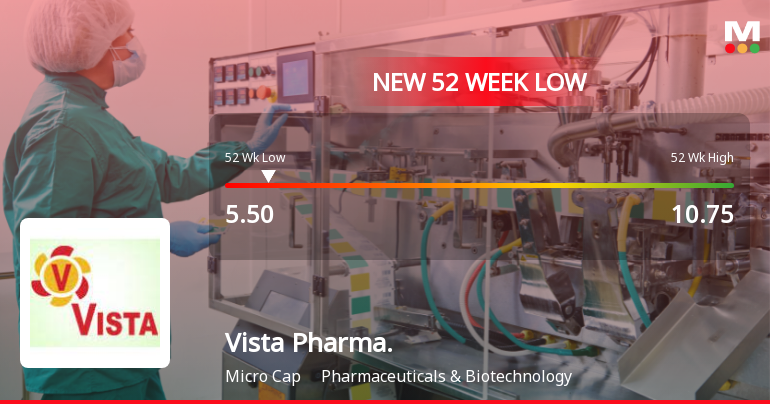
Vista Pharmaceuticals Ltd Falls to 52-Week Low of Rs 5.5 as Sell-Off Deepens
For the second consecutive session, Vista Pharmaceuticals Ltd has seen its share price decline, hitting a fresh 52-week low of Rs 5.5 on 8 Sep 2026. This latest drop extends the stock’s downward trajectory, which has now resulted in a 5.41% loss over just two days, underscoring persistent selling pressure amid broader market weakness.
Read full news article
Vista Pharmaceuticals Ltd is Rated Strong Sell
Vista Pharmaceuticals Ltd is rated Strong Sell by MarketsMOJO. This rating was last updated on 18 July 2024. However, the analysis and financial metrics discussed below reflect the company’s current position as of 27 August 2026, providing investors with the latest insights into the stock’s performance and outlook.
Read full news article
Vista Pharmaceuticals Ltd is Rated Strong Sell
Vista Pharmaceuticals Ltd is rated Strong Sell by MarketsMOJO. This rating was last updated on 18 July 2024, but the analysis below reflects the stock’s current position as of 12 August 2026, incorporating the latest fundamentals, returns, and financial metrics available today.
Read full news article Announcements
Results For The Quarter Ended 30.06.2026
14-Aug-2026 | Source : BSEResults for the quarter ended 30.06.2026
Board Meeting Outcome for Results For The Quarter Ended 30.06.2026
14-Aug-2026 | Source : BSEResults for the quarter ended 30.06.2026
Board Meeting Intimation for Approval Of Un Audited Financials Results For The Quarter Ended 30.06.2026
13-Aug-2026 | Source : BSEVista Pharmaceuticals Ltdhas informed BSE that the meeting of the Board of Directors of the Company is scheduled on 14/08/2026 inter alia to consider and approve 1. Unaudited financial results for the quarter ended 30.06.2026
Corporate Actions

No Upcoming Board Meetings

No Dividend history available

No Splits history available

No Bonus history available

No Rights history available
Key FactorsQuality key factors
Valuation key factors
Technicals key factors
 Technical Indicator Scale: Bearish, Mildly Bearish, Sideways, Mildly Bullish, Bullish Turned Shareholding
Shareholding Snapshot : Jun 2026
Shareholding Compare (%holding)
Non Institution
None
Held by 4 Schemes (0.02%)
Held by 0 FIIs
Vista Pharmaceuticals Inc (10.69%)
Murali Meraga (14.62%)
33.63%
FinancialQuarterly Results Snapshot (Standalone) - Jun'26 - QoQ
 Compare with Peers
QoQ Growth in quarter ended Jun 2026 is 0.00% vs -100.00% in Mar 2026
QoQ Growth in quarter ended Jun 2026 is 83.11% vs -152.59% in Mar 2026

Half Yearly Results Snapshot (Standalone) - Sep'25

Growth in half year ended Sep 2025 is -30.54% vs -21.28% in Sep 2024
Growth in half year ended Sep 2025 is -112.02% vs 38.38% in Sep 2024
Nine Monthly Results Snapshot (Standalone) - Dec'25
YoY Growth in nine months ended Dec 2025 is -21.17% vs -4.20% in Dec 2024
YoY Growth in nine months ended Dec 2025 is -96.83% vs 31.52% in Dec 2024
Annual Results Snapshot (Standalone) - Mar'26
YoY Growth in year ended Mar 2026 is -46.38% vs -2.14% in Mar 2025
YoY Growth in year ended Mar 2026 is -159.35% vs -3.10% in Mar 2025
 Company CV
About Vista Pharmaceuticals Ltd

Company Coordinates










