
Compare Vivid Global with Similar Stocks
Dashboard
Weak Long Term Fundamental Strength with a -2.73% CAGR growth in Operating Profits over the last 5 years
- Company's ability to service its debt is weak with a poor EBIT to Interest (avg) ratio of 0.68
- The company has been able to generate a Return on Equity (avg) of 3.56% signifying low profitability per unit of shareholders funds
With ROE of 4.6, it has a Expensive valuation with a 1.2 Price to Book Value
Stock DNA
Commodity Chemicals
INR 19 Cr (Micro Cap)
27.00
43
0.00%
-0.21
4.62%
1.18
Total Returns (Price + Dividend) 
Latest dividend: 0.20206540447504306 per share ex-dividend date: Sep-21-2021
Risk Adjusted Returns v/s
Returns Beta

News

Vivid Global Industries Ltd Downgraded to Sell Amid Mixed Financial and Technical Signals
Vivid Global Industries Ltd, a micro-cap player in the commodity chemicals sector, has seen its investment rating downgraded from Hold to Sell as of 18 June 2026. This change reflects a complex interplay of deteriorating technical indicators, challenging valuation metrics, subdued financial trends, and overall quality concerns. Despite a strong one-year stock return outperforming the broader market, the company’s fundamentals and technical outlook have prompted a cautious stance from analysts.
Read full news articleAre Vivid Global Industries Ltd latest results good or bad?
Vivid Global Industries Ltd's latest financial results for Q4 FY26 present a mixed operational narrative. The company reported a net profit of ₹0.27 crores, which reflects a notable increase from the previous quarter and the same quarter last year, indicating a recovery in profitability. However, net sales for the quarter stood at ₹14.60 crores, showing a slight decline of 0.88% compared to the previous quarter, although this represents an 11.37% increase year-on-year. This stagnation in revenue growth follows a period of robust sales performance in earlier quarters, suggesting a normalization of demand in the dye intermediates market. The operating margin improved to 5.82%, marking the highest level in at least seven quarters, driven by better cost management rather than revenue growth. The PAT margin also saw an increase to 1.85%, up from 1.29% in the previous quarter, which further highlights the compan...
Read full news article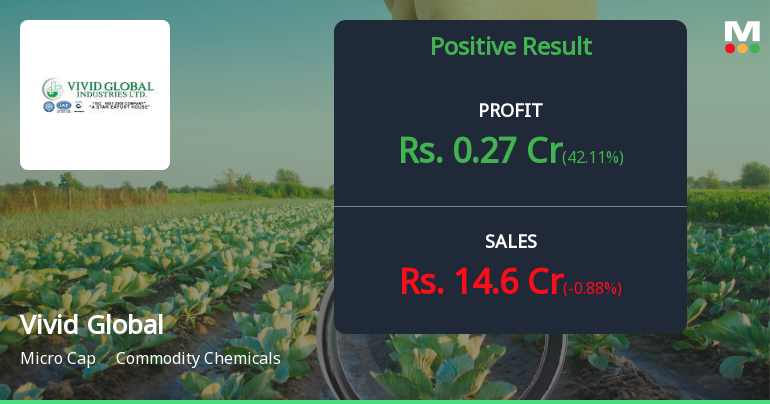
Vivid Global Industries Q4 FY26: Modest Profits Mask Persistent Margin Weakness
Vivid Global Industries Ltd., a micro-cap speciality chemicals manufacturer producing dye intermediates, reported net profit of ₹0.27 crores for Q4 FY26 (January-March 2026), marking a 42.11% sequential improvement from ₹0.19 crores in Q3 FY26 and a 125% year-on-year surge from ₹0.12 crores in Q4 FY25. Despite the profit growth, the company's stock declined 1.92% to ₹22.49 following the results announcement, reflecting investor concerns about the sustainability of margins and the company's overall operational efficiency in the commodity chemicals sector.
Read full news article Announcements
Board Meeting Outcome for Outcome Of The Board Meeting Held On 22Nd May 2026. Disclosure Under Regulation 30 Of The SEBI (Listing Obligations And Disclosure Requirements) Regulations 2015
22-May-2026 | Source : BSEThe Board of Directors in its meeting held on 22nd May 2026 at 04.00 p.m. inter-alia approved the following: 1. Audited Financial Statement of Accounts for the quarter and year ended on 31st March 2026 the audited Statement of Assets and Liabilities and the audited Cash Flow Statement as at that date along with Independent Auditors Report thereon. The Board Meeting concluded at 4:35 p.m. Kindly take the above in your records and acknowledge the receipt of the same.
Regulation 33 - Audited Financial Statement Of Accounts For The Quarter And Year Ended 31St March 2026
22-May-2026 | Source : BSEPursuant to Regulation 33 of SEBI (LODR) Regulation 2015 the board of directors in their meeting held on 22.05.2026 have approved the Audited Financials Statements alongwith the Balance sheet and cash flow for the year ended 31.03.2026 and the Independent Audit Report thereon.
Board Meeting Intimation for Board Meeting To Be Held On 22.05.2026
15-May-2026 | Source : BSEVivid Global Industries Ltdhas informed BSE that the meeting of the Board of Directors of the Company is scheduled on 22/05/2026 inter alia to consider and approve In terms of Regulation 29 read with Regulation 30 and 33 of Securities & Exchange Board of India (Listing Obligations and Disclosures) Regulations 2015 this is to inform that the Meeting of the Board of Directors of M/s. Vivid Global Industries Limited will be held on 22nd May 2026 Friday at the Corporate Office of the Company at C/O. Sumichem Corporation 1-D Dhannur Building Sir P. M. Road Fort Mumbai - 400001 at 04.00 p.m. to consider and approve the followings: 1.To consider approve and adopt audited Financial Results for the quarter and year ended 31st March 2026 along with Independent Audit Report thereon. 2.Any other matter with the permission of the Chair. Further as informed vide our letter dated March 30 2026 the Trading Window for dealing in the securities of the Company was closed from April 01 2026 and shall remain closed till 48 hours after the announcement of financial results by the Board of Directors at its meeting scheduled to be held on May 22 026.
Corporate Actions

No Upcoming Board Meetings

Vivid Global Industries Ltd has declared 4% dividend, ex-date: 21 Sep 21

Vivid Global Industries Ltd has announced 5:10 stock split, ex-date: 02 Dec 15

No Bonus history available

No Rights history available
Quality key factors
Valuation key factors
Technicals key factors
 Technical Indicator Scale: Bearish, Mildly Bearish, Sideways, Mildly Bullish, Bullish Turned
 Shareholding Snapshot : Mar 2026
Shareholding Compare (%holding)
Non Institution
None
Held by 0 Schemes
Held by 0 FIIs
Sumish S Mody (18.98%)
Sumiran Sumish Mody (2.9%)
44.87%
Quarterly Results Snapshot (Standalone) - Mar'26 - QoQ

QoQ Growth in quarter ended Mar 2026 is -0.88% vs 5.82% in Dec 2025

QoQ Growth in quarter ended Mar 2026 is 42.11% vs 11.76% in Dec 2025
Half Yearly Results Snapshot (Standalone) - Sep'25
Growth in half year ended Sep 2025 is 20.92% vs 31.30% in Sep 2024
Growth in half year ended Sep 2025 is 58.82% vs 240.00% in Sep 2024
Nine Monthly Results Snapshot (Standalone) - Dec'25
YoY Growth in nine months ended Dec 2025 is 40.43% vs 14.06% in Dec 2024
YoY Growth in nine months ended Dec 2025 is 76.92% vs 225.00% in Dec 2024
Annual Results Snapshot (Standalone) - Mar'26
YoY Growth in year ended Mar 2026 is 31.11% vs 19.21% in Mar 2025
YoY Growth in year ended Mar 2026 is 87.18% vs 116.67% in Mar 2025
About Vivid Global Industries Ltd

Company Coordinates


